
Figure 2.
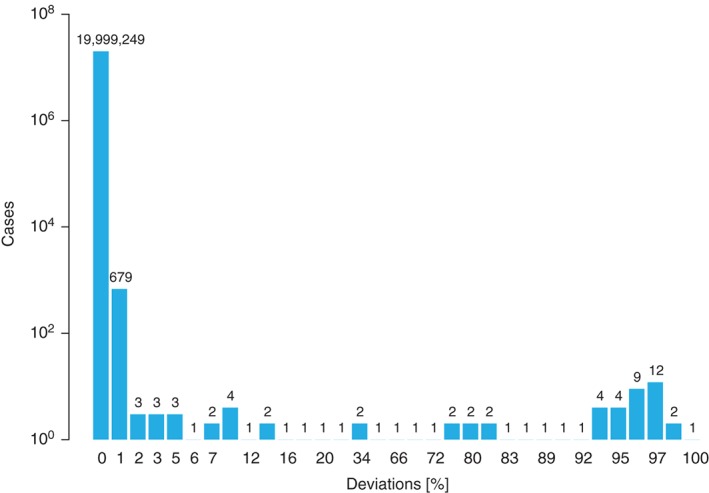
Distribution of the discrepancies for the 9/10 and 10/10 predictions of algorithm #1 compared to algorithm #2 in matching validation task (MVT) 3. The comparison encompasses 2 × 10⁷ data items.
Official websites use .gov
A
.gov website belongs to an official
government organization in the United States.
Secure .gov websites use HTTPS
A lock (
) or https:// means you've safely
connected to the .gov website. Share sensitive
information only on official, secure websites.
Distribution of the discrepancies for the 9/10 and 10/10 predictions of algorithm #1 compared to algorithm #2 in matching validation task (MVT) 3. The comparison encompasses 2 × 10⁷ data items.