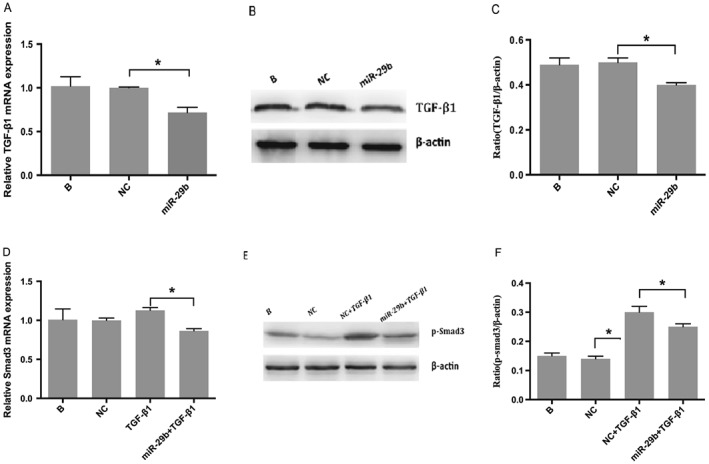
Figure 6.

Effects of miR‐29a on TGF‐β1 and Smad3. Real‐time RT‐PCR (A) and western blot (B, C) indicated that TGF‐β1 levels decreased significantly (P < 0.05) after transfection with miR‐29a mimics. Panel D depicts a decrease in Smad3 RNA after transfection with miR‐29b mimics detected by real‐time RT‐PCR, whereas panels E and F reveal a decrease in p‐Smad3 (active form of Smad3) protein examined by western blot
