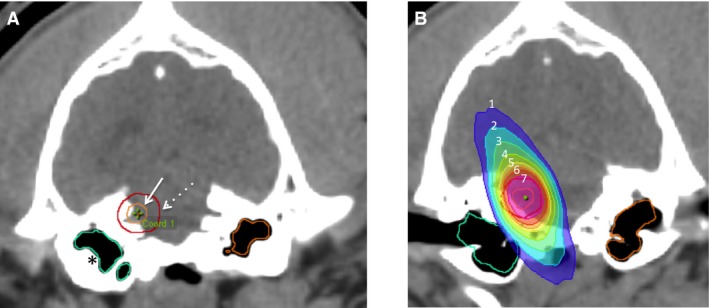
Figure 1.

Example contouring and treatment isodose distribution. (A) GTV (solid arrow), PTV expansion (dashed arrow), and inner ear contours (asterisks). (B) Isodose distribution for the radiation plan (isodose lines represent percentage of prescribed dose: 1: 30%, 2: 40%, 3: 80%, 4: 90%, 5: 95%, 6: 100%, 7: 107%).
