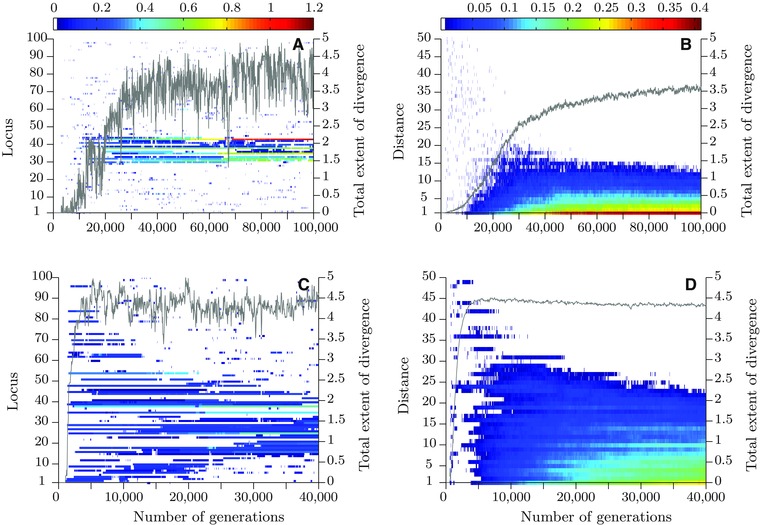
Figure 1.

Multilocus model results. Panels (A) and (C): temporal dynamics of extents of local genomic divergence (truncated to the range indicated by the color bar) in single stochastic realizations of the model for weak selection (A) and for strong selection (C). The gray lines show the corresponding total extents of genomic divergence (the values are given on the y‐axis on the right). Panels (B) and (D): correlations of extents of divergence at pairs of loci as a function of their distance (measured in units of the recombination rate, r) averaged over 90 independent realizations for the parameters in (A) and (C), respectively. Correlations are color coded (see the color bar). Gray lines show the corresponding total extents of divergence averaged over 90 independent realizations. Other parameter values: selection parameter (in A and B) or (in C and D); population size, ; mutation rate, ; root mean square of mutation‐effect sizes, ; migration rate, m = 0.1; recombination rate between a pair of adjacent loci, ; number of adaptive loci, . Note that the timescales in the upper panels differ from those in the bottom ones. (To interpret the references to color in this figure caption, the reader is referred to the web version of this article.)
