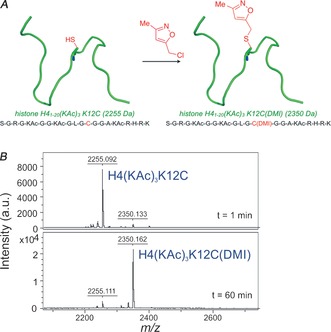
Figure 4.

A) A cartoon representing H4(KAc)3K12C alkylation. B) Regions of MALDI‐TOF‐MS spectra of samples taken at the time indicated during the alkylation of H4(KAc)3K12C under optimized conditions: 1 mm H4(KAc)3K12C, 4 m guanidine hydrochloride, 10 mm methionine, 5 mm TCEP, 1 m CHES (pH 9), 5 mm Cl‐DMI, showing conversion from starting peptide (observed m/z 2255.09; expected m/z 2255.21) to alkylated H4(KAc)3K12C(DMI) peptide (observed m/z 2350.07; expected m/z 2350.24).
