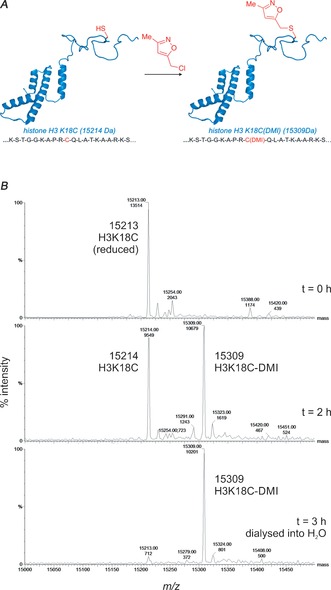
Figure 6.

A) A cartoon representing histone H3 alkylation. B) LCMS monitoring H3K18C protein alkylation with Cl‐DMI. Deconvoluted masses (range 10.0 kDa–20.0 kDa, resolution 1.0 Da, zoomed region 15.0 kDa‐15.5 kDa) observed at time indicated bottom right. Spectra show progression from starting protein [H3K18C expected mass 15214] to monoalkylated product [H3K18C(DMI) expected mass 15309]. See the Supporting Information for full spectra (see Figure S12).
