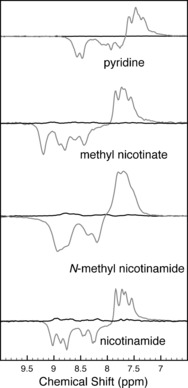
Figure 2.

1H SABRE experiments on 2 in D2O on a 42.5 MHz spectrometer (aromatic region, single scans). Top to bottom: S1, S2, S3, S4. Black traces: thermal polarization spectra, grey traces: hyperpolarized spectra.

1H SABRE experiments on 2 in D2O on a 42.5 MHz spectrometer (aromatic region, single scans). Top to bottom: S1, S2, S3, S4. Black traces: thermal polarization spectra, grey traces: hyperpolarized spectra.