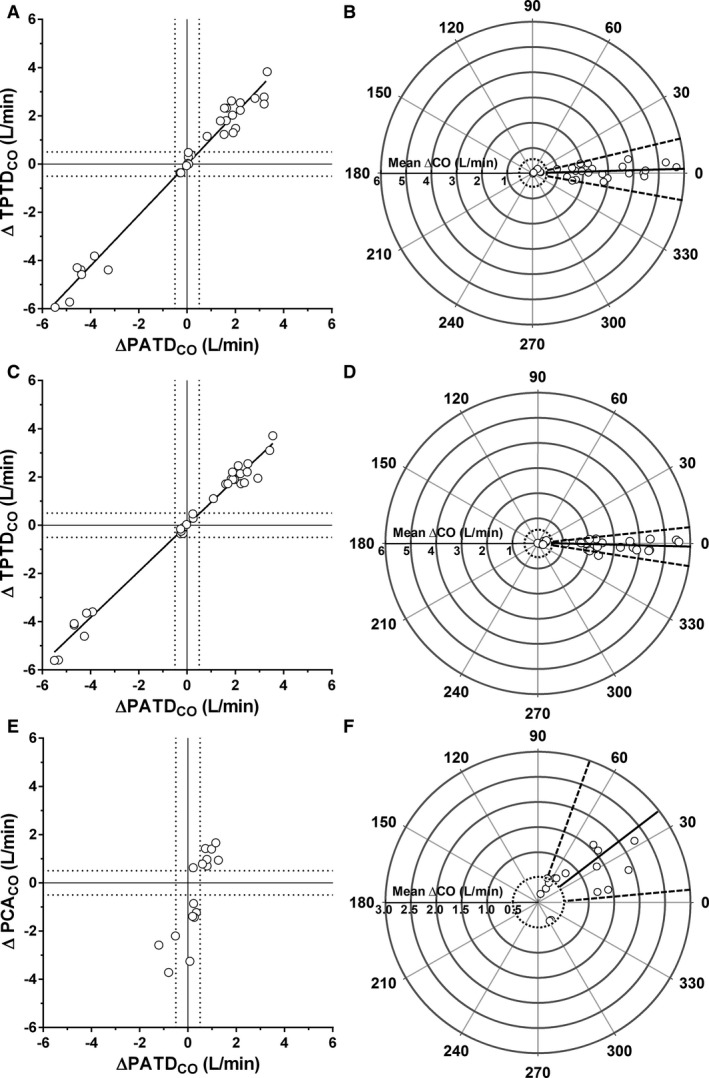
Figure 3.

Four‐quadrant and polar plots of changes in transpulmonary thermodilution cardiac output (ΔTPTDCO) in relation to changes in pulmonary artery thermodilution (ΔPATDCO) using 5 mL (A and B) and 10 mL (C and D) of ice‐cold physiological saline as thermal indicator (Phase‐1); and 4‐quadrant and polar plots of changes in pulse contour analysis cardiac output (ΔPCACO) in relation to ΔPATDCO (Phase‐2) during phenylephrine and nitroprusside‐induced changes in systemic vascular resistance (E and F). The exclusion zones (cardiac output changes ≤0.5 L/min) in 4‐quadrant plots (A, C, and E) are shown by the intersection of the dashed lines whereas in the polar plots they are shown by the dashed circles. Mean angular biases and radial limits of agreement of polar plots are shown by continuous and dashed lines, respectively (B, D, and F).
