
Figure 1.
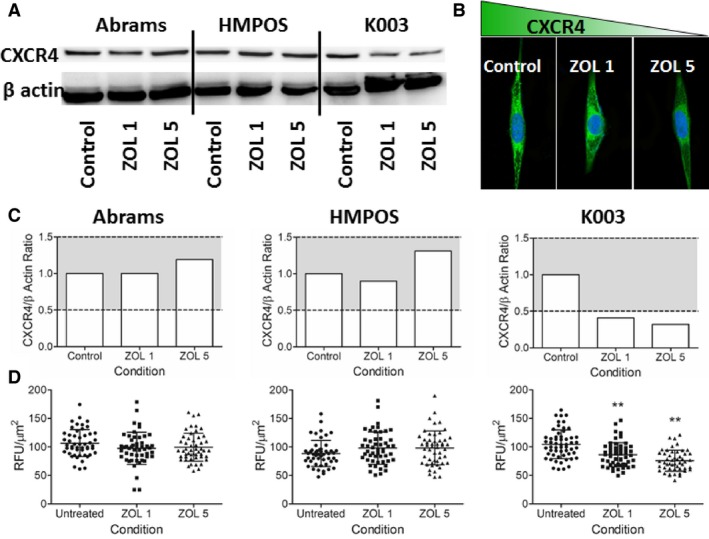
(A) Modulation of CXCR4 expression as a function of zoledronate concentration in 3 canine OS cell lines by western blot analysis. (B) Reduced CXCR4 expression by confocal fluorescent microscopy in K003 cells following exposure to zoledronate for 48 hours. (C‐D) Correlative changes in CXCR4 protein expression represented graphically as normalized values by (C) western blot and (D) confocal fluorescent microscopy. Gray shaded region (C) denotes ± 50% qualitative change in CXCR4 protein expression relative to untreated control cells. (D) Based upon 50 cell counts, quantitative reductions in CXCR4 expression in K003 cells following exposure to low concentrations of zoledronate as assessed by confocal fluorescent microscopy. Data expressed as mean ± SD and significance defined as **P < .01.