
Figure 4.
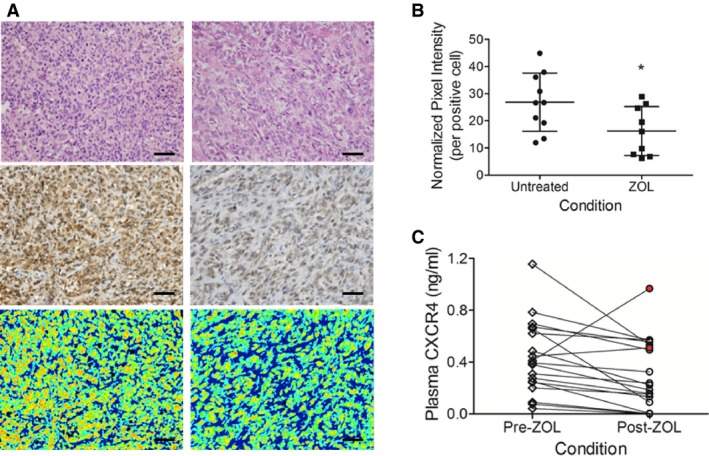
(A) Visual comparison of primary tumor OS cells by hematoxylin and eosin (top row), CXCR4 immunohistochemistry (middle row), and computer‐based fluorescence quantification of CXCR4 (bottom row) from untreated (left panel) and zoledronate‐treated (right panel) dogs. (B) Reductions in CXCR4 expression by computer‐based fluorescence quantification in dogs receiving serial zoledronate therapy prior to limb amputation compared to untreated control dogs. (C) Directional changes in plasma soluble CXCR4 concentrations achieved in dogs 28‐days following treatment with intravenous infusions of zoledronate. Red filled circles identify 2 animals that had elevations in plasma soluble CXCR4 following zoledronate exposure. Data expressed as mean ± SD and significance defined as *P < .05. Scale bar = 100 microns.