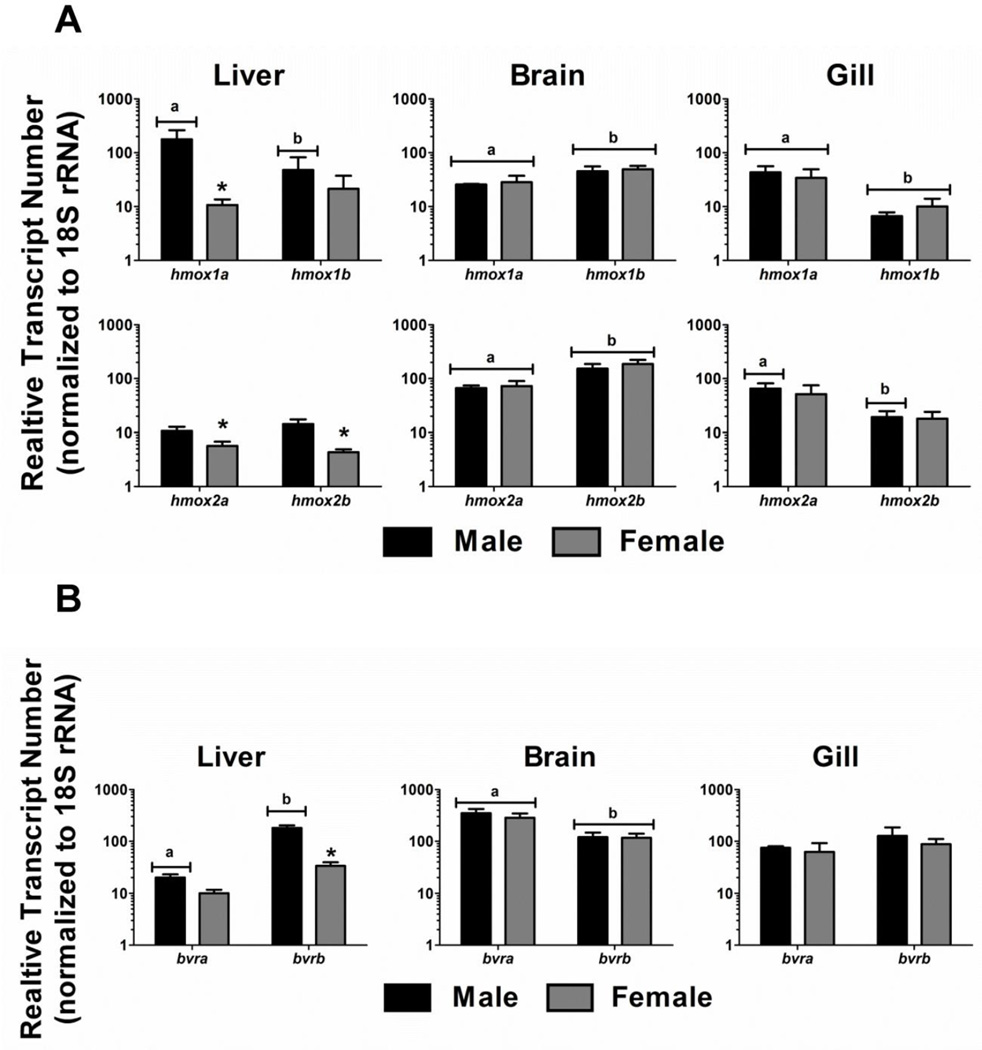
Figure 3. HO and BVR expression in adult zebrafish tissues.
Relative transcript abundance of hmox1 and hmox2 paralogs and bvr isoforms were determined in male and female liver, gill, and brain tissues. Statistical significance in transcript expression between males and females was determined using two-way ANOVA followed by a Bonferroni post hoc test (p-value < 0.05). The asterisk designates statistical significance between males and females. Different letters represent statistical significance between paralogous genes. All values are normalized to 18S ribosomal RNA. Error bars represent one standard deviation; n = 3 biological replicates per treatment. A) Expression levels of hmox1a, hmox1b, hmox2a and hmox2b. B) Expression levels of bvra and bvrb.

