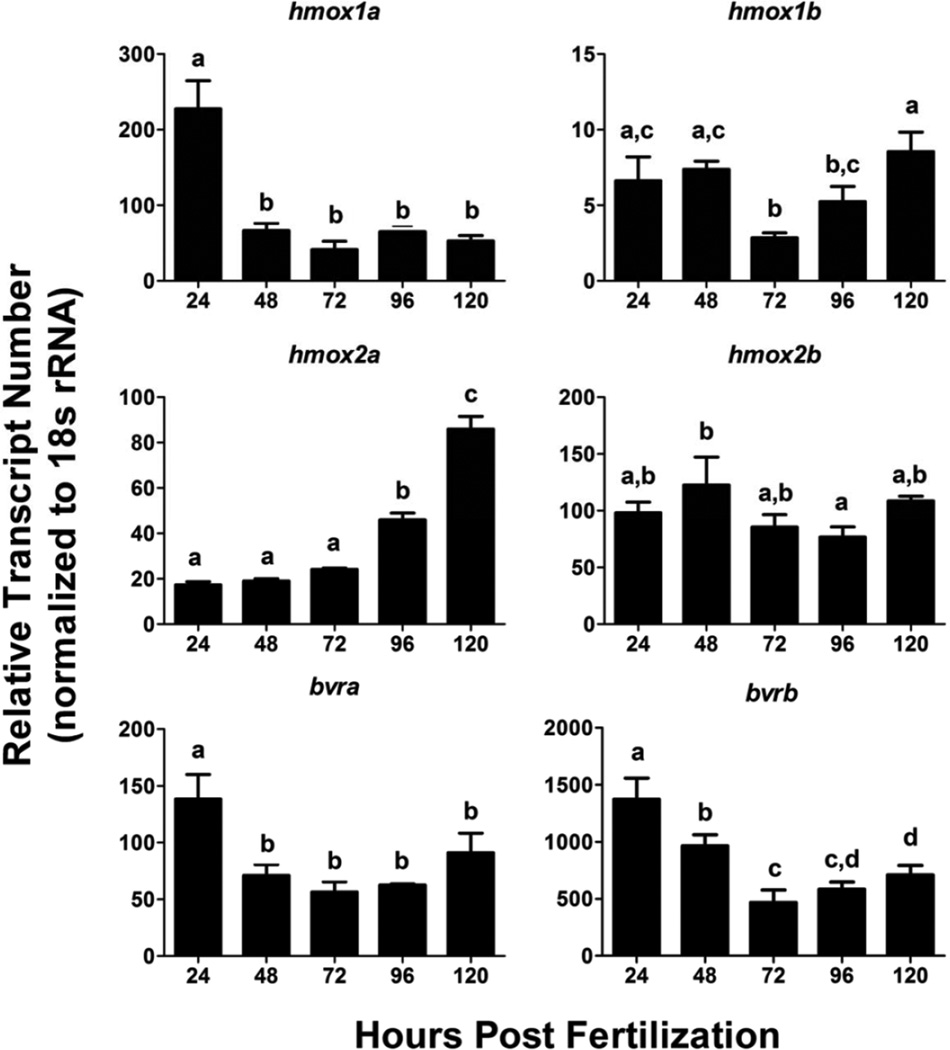
Figure 6. Changes in expression of hmox and bvr between 24–124 hpf.
Relative transcript abundance of each transcript was determined via real-time RT-PCR. Statistical significance in transcript expression in comparison to 24 hpf embryos was determined using one-way ANOVA followed by a Bonferroni post hoc test (*p-value < 0.05). Different letters represent statistical significance between developmental timepoints. All values are normalized to 18S ribosomal RNA. Error bars represent one standard deviation; n = 3 biological replicates of 20 pooled embryos per treatment. hpf = hours past fertilization.

