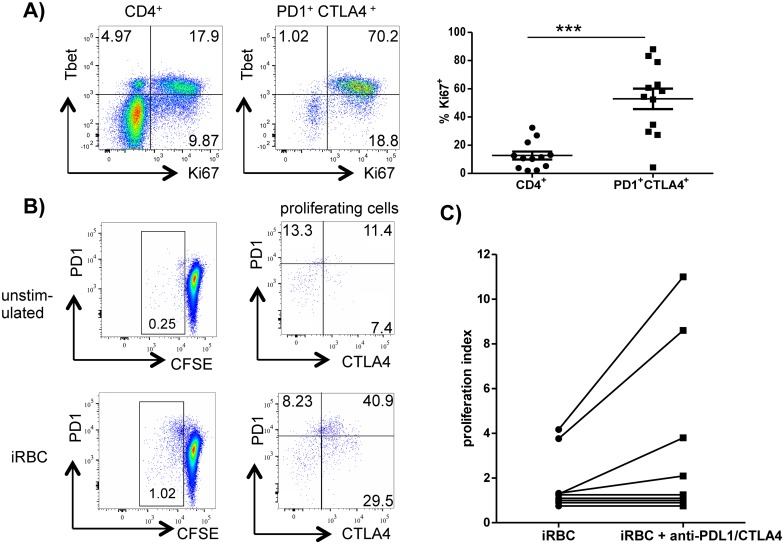
Fig 2. PD1+CTLA4+ CD4+ T cells are malaria-specific.
A) Whole blood samples of malaria patients were analyzed for ex-vivo expression of intracellular Ki67 and Tbet on CD4+ and PD1+CTLA4+CD4+ T cells. Dotplots show one representative donor out of 5. Scatter plots show the frequency of Ki67 expression on the assessed CD4+ T cells (left) and PD1+CTLA4+CD4+ T cells (right) for all malaria patients included in the analysis (N = 12). *** P < 0.001. B) PBMC of malaria patients were labeled with CFSE and stimulated with/without iRBC. Cells were first gated for CD4+ T cells. Proliferating cells were further analyzed for expression of CTLA4 and PD1. The assay is shown here for one representative malaria patient out of three. The other two patients are presented in S6 Fig. C) PBMC were stimulated with iRBC with/without the addition of 10μg/ml anti-PDL1 and anti-CTLA4 and 3H uptakes measured after 120hrs of culture. Proliferation indices were calculated by dividing 3H counts of stimulated cells by 3H counts of unstimulated cells. A proliferation index > 2 was considered to be a positive response. (n = 11).

