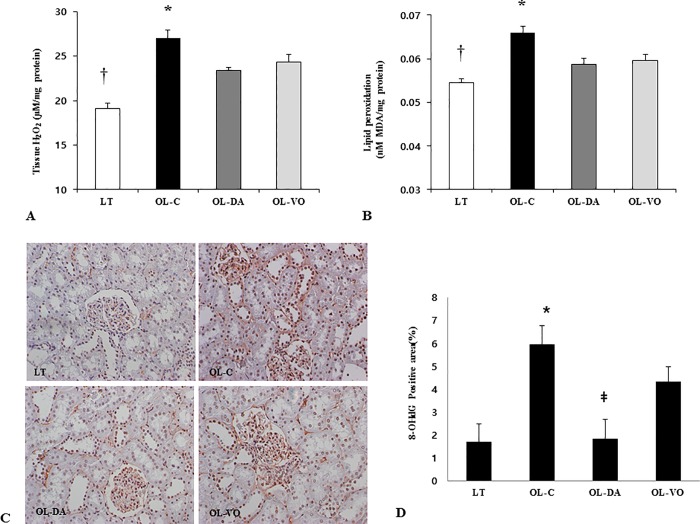
Fig 5. Oxidative stress markers in renal tissues.
The levels of renal H2O2 (A) and malondialdehyde (MDA) (B), 8-OHdG immunostaining (x 200, C), quantitative measurement of 8-OHdG staining (D) in LETO (LT) and OLETF rats with saline (OL-C), dapagliflozin (OL-DA) or voglibose (OL-VO) treatment. *P < 0.05, OL-C vs. other groups; †P < 0.05, LT vs. other groups; ‡P < 0.05, OL-DA vs. OL-VO. Values are expressed as means ± SE. 8-OHdG, 8-hydroxy-2-deoxy guanosine.

