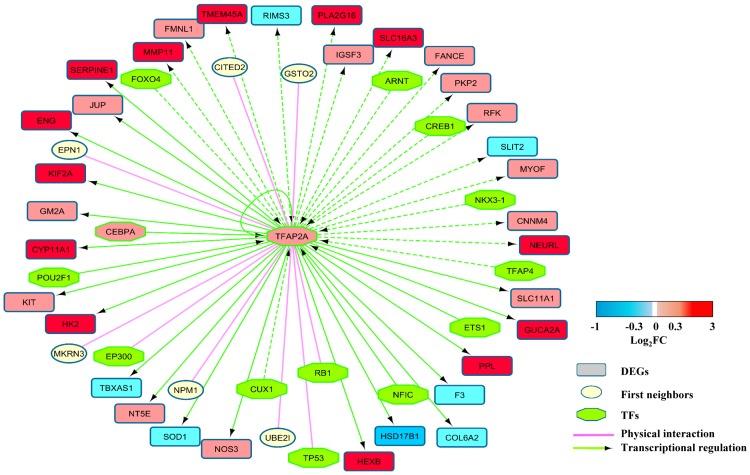
Fig 1. The interactions of AP2A in the composite extended network.
The proteins encoded by the DEGs identified by the meta-analysis are shown as ellipses colored in red when up-regulated or blue if down-regulated. First neighbors of the proteins encoded by the DEGs are show as circles colored in yellow. Transcription factors are shown as octagons colored in green (or red/blue if they belong to the DEGs). Physical interactions are depicted in mauve and regulatory interactions in green. The regulatory interactions are shown as a continuous line when validated experimentally or as a discontinuous line when predicted on the basis of the presence of a transcription binding site (TFBS) in the target gene.

