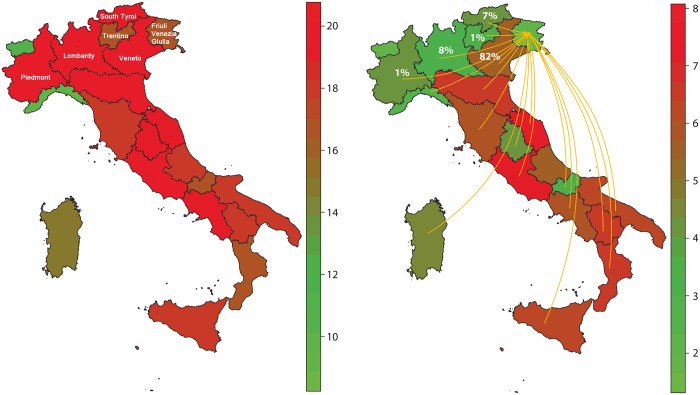
Fig 4. DCIN and WDCIN values for IT2009 data.
The WDCIN (on the right) shows a more evident variability among regions than DCIN (on the left). The scale bars report the DCIN and WDCIN values for each region. In case of Friuli-Venezia-Giulia region, in the north-east part of Italy, the two measures are particularly different (DCIN = 17 and WDCIN = 1.73). Arrows representing in-going links are reported (17 regions), but only 5 regions already cover the 99% of the weights (fi values are reported on the corresponding region).

