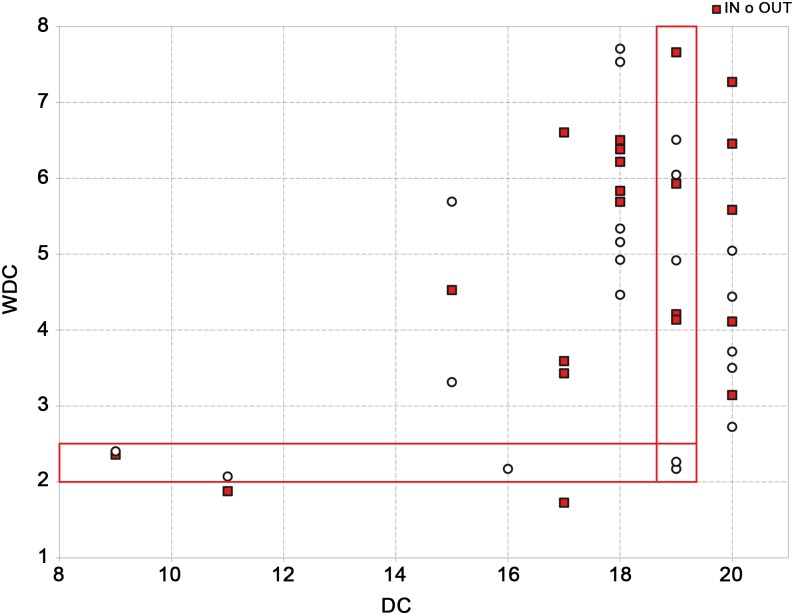
Fig 5. Correlation between the two measures DC and WDC of the IT2009 network.
The correlation shows a moderate agreement between DC and WDC (0.55 ‘in’ and 0.31 ‘out’). For example, in 5 regions the same value of 19 for out-degree, is associated to a weighted out degree range of 2–7 and vice-versa 5 regions with values of weighted out-degree between 2 and 2.5, have values of out-degree ranging from 9 to 19.

