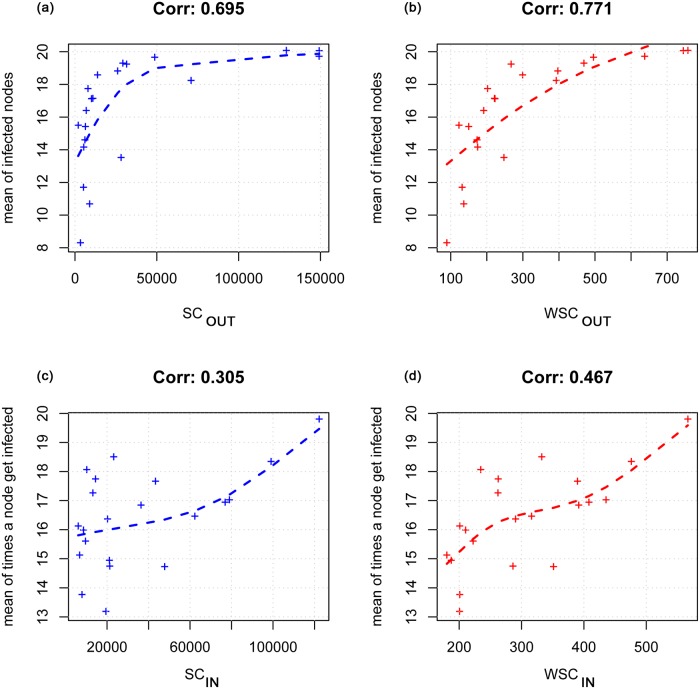
Fig 8. Correlation between model results and the strength centrality measures for the randomized network.
In the upper side of the figure the correlation between the node’s risk (the mean number of infected nodes) and SCOUT (a) and WSCOUT (b) is showed; the last two graphs report the correlation between node’s vulnerability (the mean number of times a node gets infected) and the SCIN (c) and WSCIN(d).

