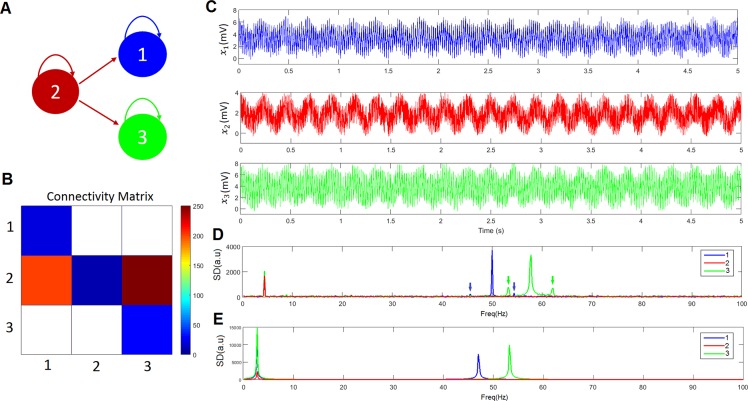
Fig 2. Three population toy model.
A) The model comprises three neuronal populations labelled as ‘1’, ‘2’, and ‘3’, coloured in blue, red and green, respectively. This color legend is used across all panels in the figure. B) Connectivity matrix. C) Temporal dynamics of the three neuronal populations. D) Spectral density. The low frequency (4.40 Hz) is modulating the higher frequencies (50 and 57.8 HZ) which is demonstrated by the appearance of secondary peaks at frequencies 50Hz ± 4.40 Hz and 57.8Hz ± 4.40 Hz on both sides of the main peaks. The secondary peaks are indicated with arrows. E) Spectral density when substituting the sigmoid function with the linear function S(x) = x.

