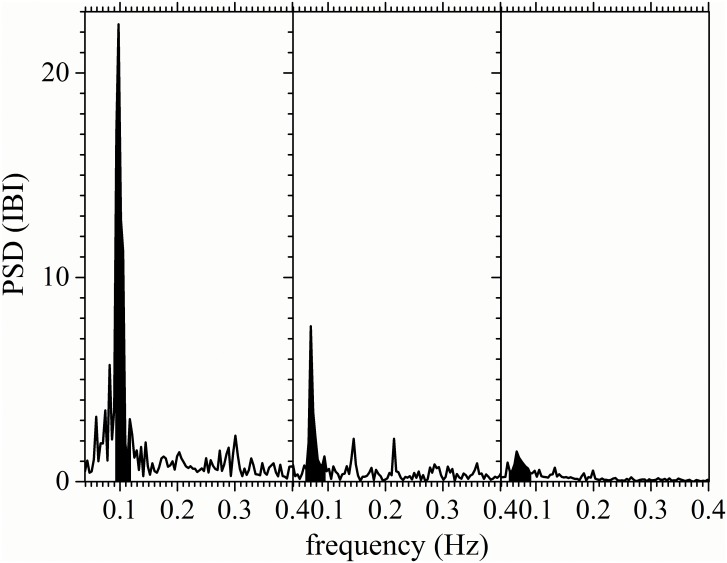
Fig 2. Respiratory peak on the frequency domain.
Typical power spectral density (PSD) of IBI records during a controlled breathing test for a control subject (left-hand panel), a recently diagnosed DM patient (middle panel) and a long-standing DM patient (right-hand panel). The dominant respiratory peak (RP) region is shaded black.

