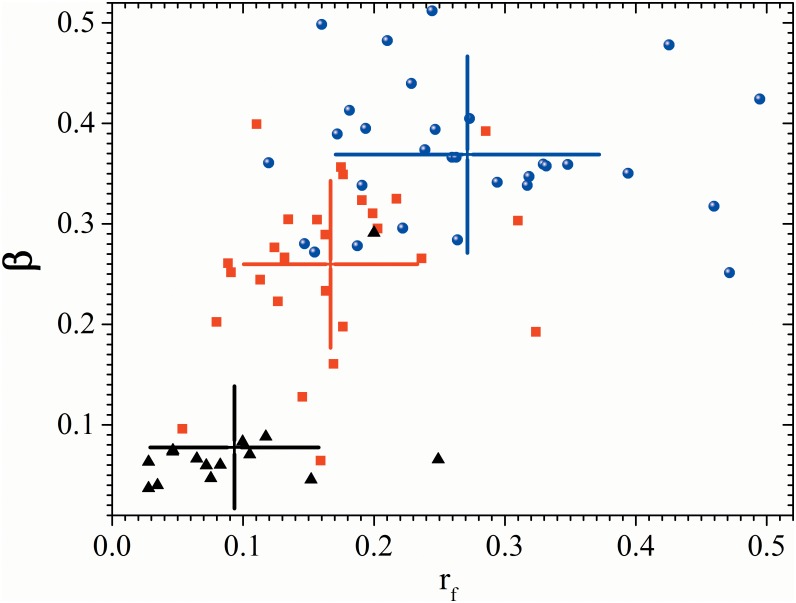
Fig 3. β parameter of all the patients.
Scatter plot of β (breathing to total variability ratio) against rf (frequency radius) during controlled breathing test for control subjects (blue dots), recently diagnosed DM patients (red squares) and long-standing DM patients (black triangles). Cross-hairs correspond to one standard deviation centered on the group average.

