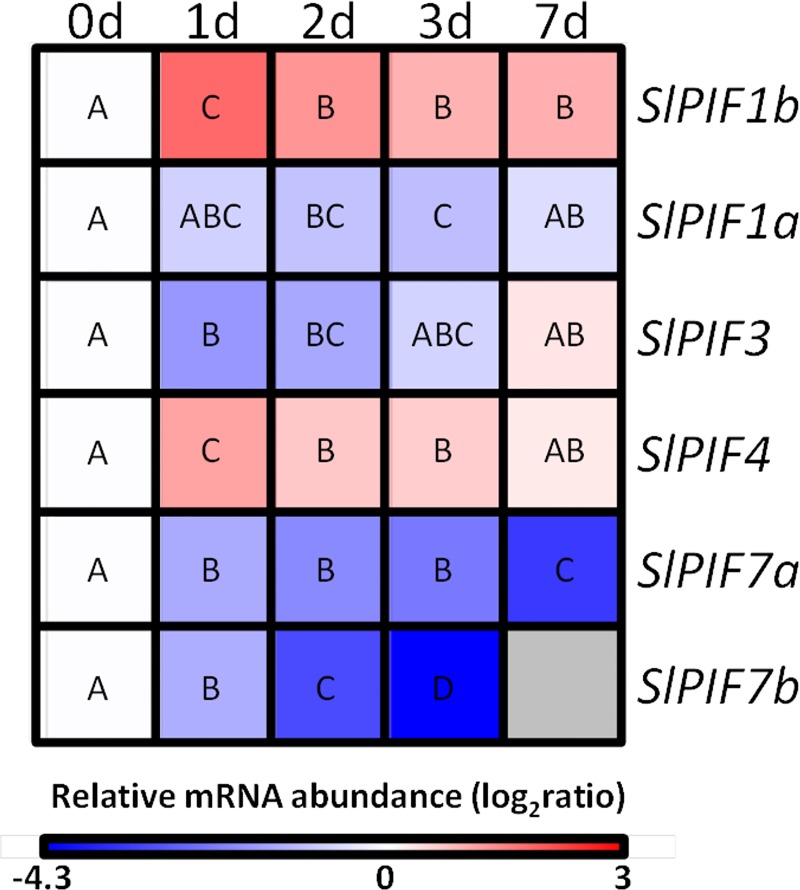
Fig 5. Expression profile of PIF genes during dark-induced senescence.
3-week-old plants were grown under 12 h/12 h light/dark photoperiod and transferred to constant darkness during 7 d and the second fully expanded leaves was sampled every day 4 h after the beginning of the light period. Heatmap representation of the relative mRNA abundance compared to day 0. Different letters indicate statistical differences (P<0.05). Values shown are means ± SE of at least three biological replicates.

