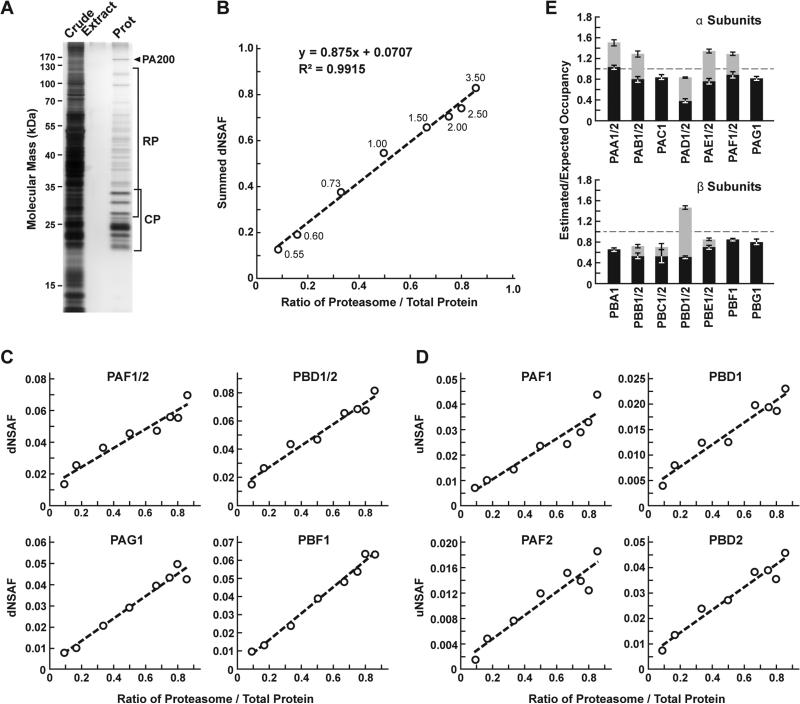
Figure 2.
Confirmation of MSpC accuracy by analysis of MS/MS datasets generated with affinity purified Arabidopsis 20S proteasomes spiked into a total cell lysate from E. coli. Following MS/MS analysis, the dNSAF and uNSAF values for each subunit/isoform were determined by Morpheus and MSpC. (A) A silver-stained SDS-PAGE gel of 20S proteasome samples affinity purified from 10-d-old Arabidopsis seedlings. The crude seedling extract (CE), sample buffer (SB), and affinity-purified 20S proteasome samples (Prot) are shown. (B) Quantification of trypsinized 20S proteasomes when mixed at varying ratios with trypsinized total protein lysates from E. coli. The spiked samples were subjected to MS/MS followed by data analysis with the Morpheus and MSpC. dNSAF values for each proteasome subunit were averaged across three technical replicates, then summed to obtain an estimate of abundance for the 20S proteasome, and plotted against their known ratios. The total protein load is listed at each point in μg. (C and D) dNSAF and uNSAF values determined from the data in panel B for individual subunits (C) and their isoforms (D) for several subunits of the 20S proteasome. (E) Quantification accuracy of the Morpheus/MSpC pipeline for determining of the amount of each α and β subunit of the 20S proteasome. Single subunit isoforms are in black, whereas subunits having two isoforms are shown in black and grey to reflect the contributions of isoforms 1 and 2 respectively. Each bar represents the average of eight technical replicates (± SE). The dashed line represents the expected value of one assuming an equal stoichiometry of each subunit within the particle.

