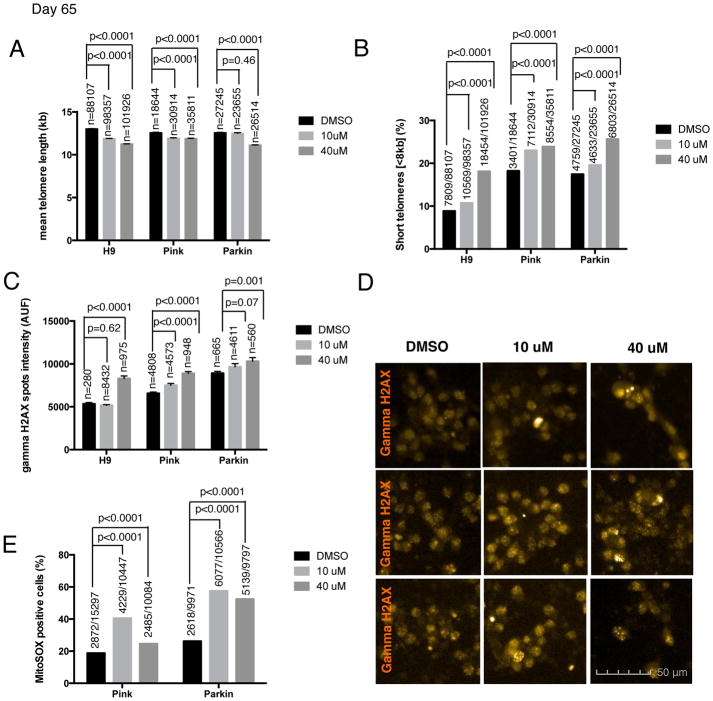
Figure 3. Shortened telomeres effect on the aging phenotype of hPSC-derived neurons.
Different aging-associated phenotypes were measured in H9 and two PD iPSC lines, PINK1 and PARKIN-derived neurons at day 65 of mDA differentiation protocol. Cells were treated with two different concentrations (10 and 40 μM) of the telomerase inhibitor BIBR1532 and DMSO was used as a control (A) Quantification of the mean ± SEM telomere length measured by HT Q-FISH in hPSC-derived neurons. Numbers above bars indicate the number of telomere spots quantified (B) Percentage of short telomeres (<8kb) measured by HT QFISH in hPSC-derived neurons. Numbers above bars indicate the number of short telomeres out of the total number of telomeres. (C) Quantitative analysis of DNA damage measured by the mean gamma H2AX intensity per nuclei expressed in arbitrary units of fluorescence (AUF). Bars are represented as mean ± SEM. Numbers above bars indicate the number of nuclei quantified (D) Representative images of gamma H2AX immunofluorescence (orange) (E) Mitochondrial ROS quantification, measured by MitoSOX assay, analyzed by FACS. Numbers above bars indicate the number of MitoSOX positive cells out of the total number of cells.

