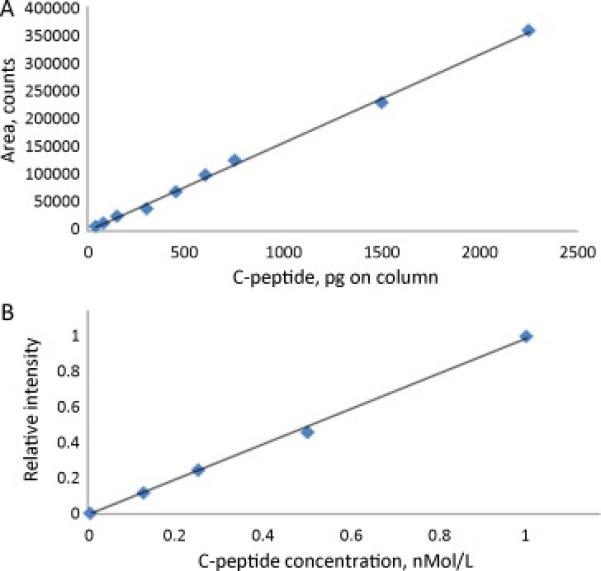
Figure 5.

Linearity of C-peptide signal response in LC-MS.
A: C-peptide signal area versus the total load on column. Pure C-peptide standard is used, 10 ng/mL.
B: C-peptide concentration measured for a series of progressive dilutions of the initial serum sample of fixed concentration. Normalized signal intensity is shown.
