
Figure 5.
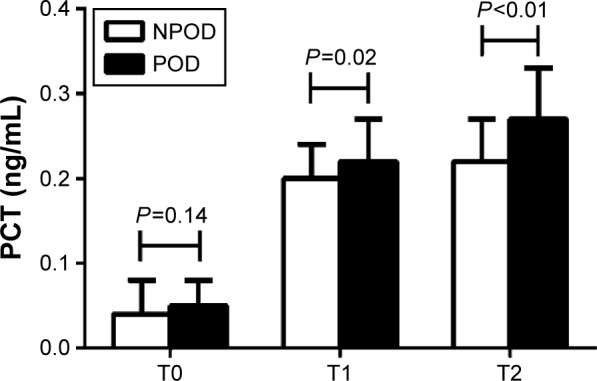
Concentration of PCT between the NPOD and POD groups.
Notes: There were no significant differences in the PCT levels between the two groups prior to surgery (T0) (P=0.14). At the end of surgery (T1) and 12 h after surgery (T2), the PCT levels were higher in the POD than that in NPOD group (P=0.02 and P<0.01). At T1 and T2, the levels of PCT in each group were higher than those in the corresponding group at T0 (P<0.05).
Abbreviations: NPOD, no POD; POD, postoperative delirium; PCT, procalcitonin; h, hours.