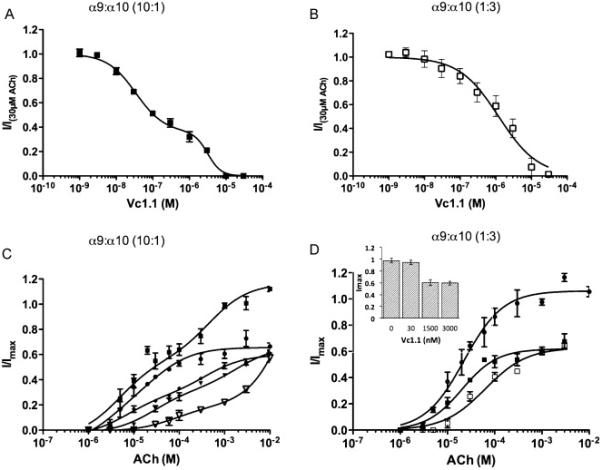
Figure 3.

A Inhibition curve of 30 μM ACh-evoked currents in Ca2+ free, 1.8mM Ba2+ solution by Vc1.1 in oocytes expressing α9α10 receptors injected in a 10:1 subunit ratio (n=4). Normalized response fitted to a biphasic regression line (■, solid line). B Inhibition curve of 30 μM ACh-evoked currents in Ca2+ free, 1.8mM Ba2+ solution by Vc1.1 in oocytes expressing α9α10 receptors injected in a 1:3 subunit ratio (n=4). Normalized response fitted to a monophasic regression line (□, solid line). C. ACh concentration response curve for α9α10 injected in a 10:1 ratio with varying concentrations of Vc1.1 - No Vc1.1 (■, solid line), 30nM Vc1.1 (●, solid line), 100nM Vc1.1 (◆, dashed line), 1.5μM Vc1.1 (▼, solid line), 3μM Vc1.1 ( , solid line). D ACh concentration response curve for α9α10 injected in a 1:3 ratio in the presence of varying concentrations of Vc1.1 – No Vc1.1 (●, solid line), 1.5μM Vc1.1 (■, solid line), 3μM Vc1.1 (□, solid line). The inset compares the maximal ACh response in presence of various concentrations of Vc1.1 (0, 30, 1500 and 3000nM). Data are shown as mean ± s.e.m.
