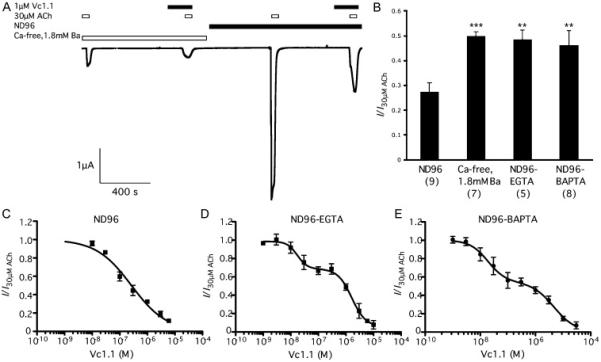
Figure 5.

A Representative trace from a single experiment superfused with Ca2+ free, 1.8mM Ba2+ solution (left) with response to 30 μM ACh and 30 μM ACh in the presence of 1 μM Vc1.1, then the same cell is superfused with ND96 and the response to 30μM ACh and 30 μM ACh in the presence of 1 μM Vc1.1. B Bar graph showing the response to 30 μM ACh and 1 μM Vc1.1 normalised to the response of 30 μM ACh for each cell. The responses in ND96, Ca2+ free, 1.8mM Ba2+ solution and ND96 with intracellular EGTA or BAPTA are shown as mean±s.e.m (n is shown in brackets, **p<0.01, ***p<0.001 one-way ANOVA, Tukey's post-hoc test). Note that the responses in ND96 and Ca2+ free, 1.8mM Ba2+ solution were derived from the same oocytes. C-E Inhibition curve of 30 μM ACh-evoked currents in ND96 solution by Vc1.1 in (C) ND96, (D) ND96 with intracellular EGTA and (E) ND96 after intracellular injection of BAPTA in oocytes expressing α9α10 receptors injected in a 1:1 subunit ratio (n≥4).
