
Figure 1.
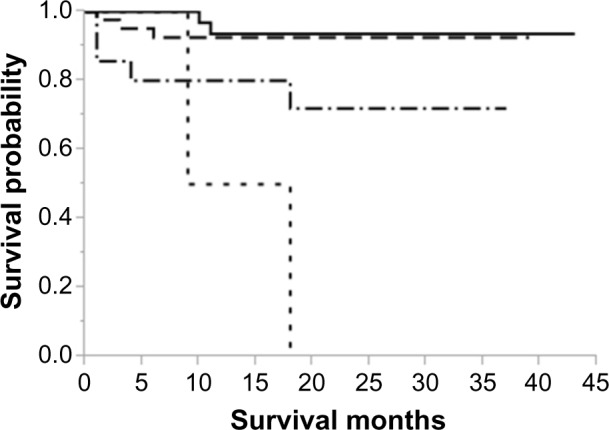
Kaplan–Meier survival curves according to severity of CAT score. Solid line: CAT score ≤10; dash line: 11–20; dash and dotted line: 21–30; dotted line: >30. Survival curves were compared with the log-rank statistic, P = 0.0002.
Official websites use .gov
A
.gov website belongs to an official
government organization in the United States.
Secure .gov websites use HTTPS
A lock (
) or https:// means you've safely
connected to the .gov website. Share sensitive
information only on official, secure websites.
Kaplan–Meier survival curves according to severity of CAT score. Solid line: CAT score ≤10; dash line: 11–20; dash and dotted line: 21–30; dotted line: >30. Survival curves were compared with the log-rank statistic, P = 0.0002.