Figure 6. Endogenous hCPEB4 is phosphorylated and monomeric in M-phase.
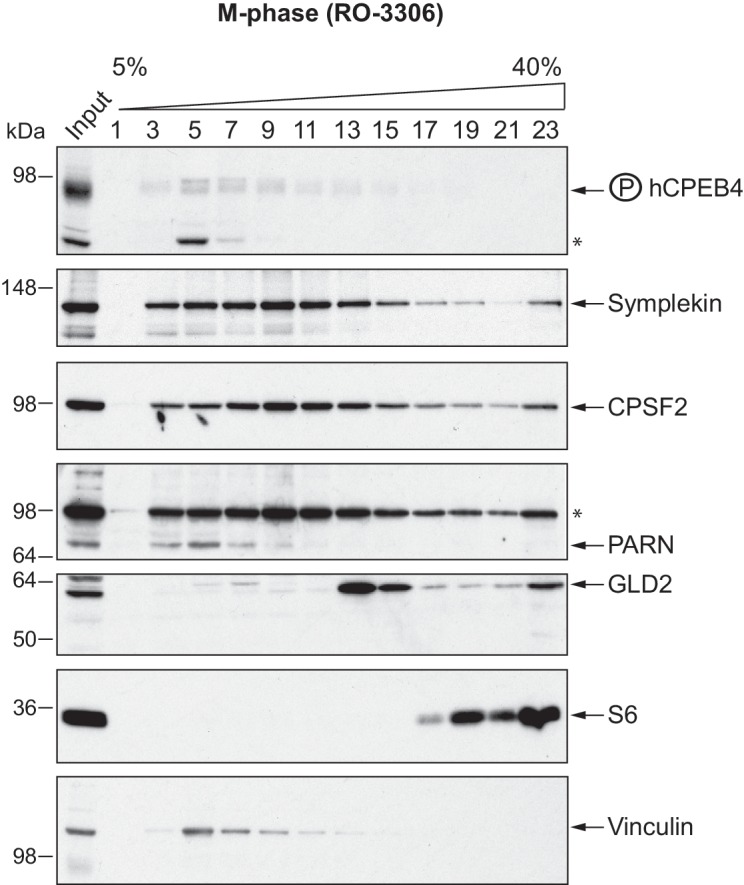
(A) Lambda-phosphatase assay (λ) of cell extracts from asynchronous (Async.) or M-phase U2OS cells synchronized with either nocodazole (Noco.) or RO-3306. Western blots against hCPEB4, the mitotic marker phospho-histone H3 and Vinculin (as a loading control) are shown. See also Figure 6—figure supplement 1. (B) Cell extracts from asynchronous or M-phase U2OS cells (synchronized with nocodazole) were resolved in 5–40% sucrose gradients. Distribution of hCPEB4, Symplekin, CPSF2, PARN, GLD2 and the ribosomal protein S6 along the gradient are shown. Vinculin was used as a reference control. Asterisks indicate unspecific bands. See also Figure 6—figure supplement 2. (C) Quantification of hCPEB4, from asynchronous and M-phase cells, distribution along 5–40% sucrose gradients. Results, from three independent biological replicates, are shown as means and SEM.

Figure 6—figure supplement 1. Immunofluorescence of endogenous hCPEB4 in U2OS cells.

Figure 6—figure supplement 2. hCPEB4 (from M-phase cells synchronized with RO-3306) distribution along 5–40% sucrose gradients.