. 2016 Nov 1;5:e19274. doi: 10.7554/eLife.19274

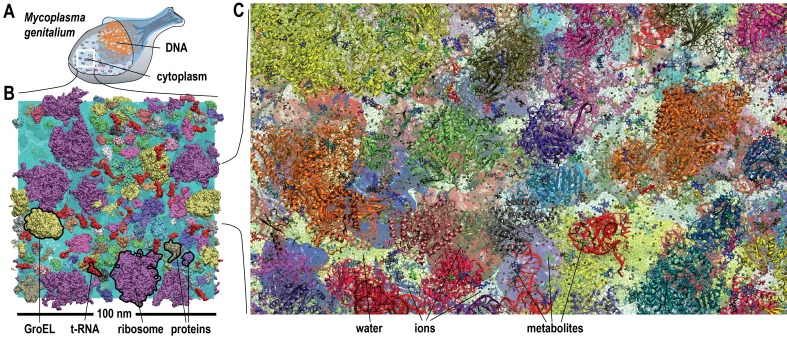
Figure 1. Molecular model of a bacterial cytoplasm.

(A) Schematic illustration of Mycoplasma genitalium (MG). (B) Equilibrated MGh system highlighted with proteins, tRNA, GroEL, and ribosomes. (C) MGh cl ose-up showing atomistic level of detail. See also supplementary Figures 1 and 2 for structures of individual macromolecules and metabolites as well as supplementary Figure 3 for initial configurations of the simulated systems.

DOI: http://dx.doi.org/10.7554/eLife.19274.003

Figure 1.

Figure 1—figure supplement 1. Macromolecular components.

Figure 1—figure supplement 1.

Structures of macromolecular complexes colored by residues index with tag, Stokes radius, and name.

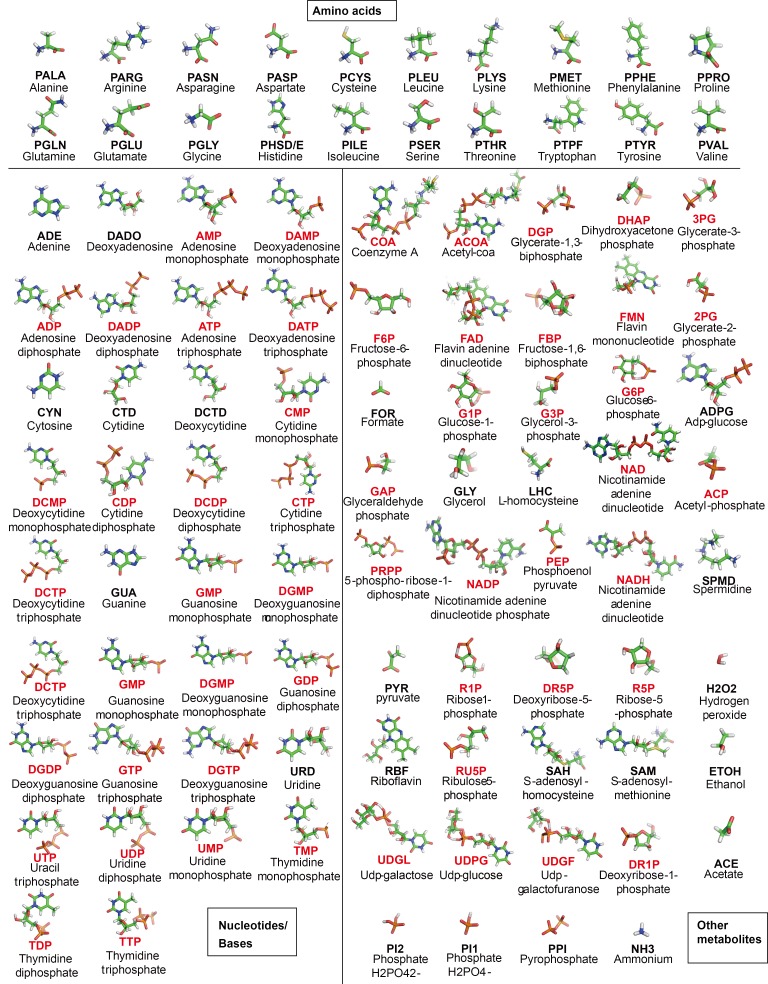
Figure 1—figure supplement 2. Structure of metabolites in MGh.

Figure 1—figure supplement 2.

For each metabolite, the abbreviation used in the text and its full name are given. Phosphates are highlighted in red.

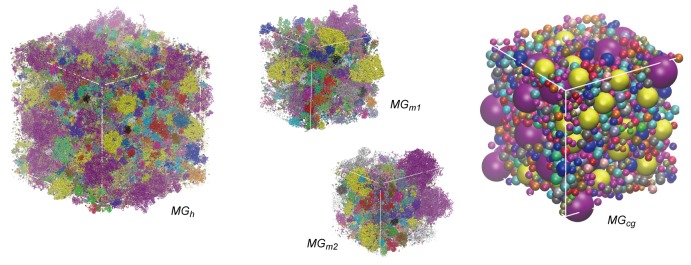
Figure 1—figure supplement 3. Initial configurations of simulated systems.

Figure 1—figure supplement 3.

Initial simulation boxes with colors indicating different macromolecular types.