. 2016 Nov 1;5:e19274. doi: 10.7554/eLife.19274

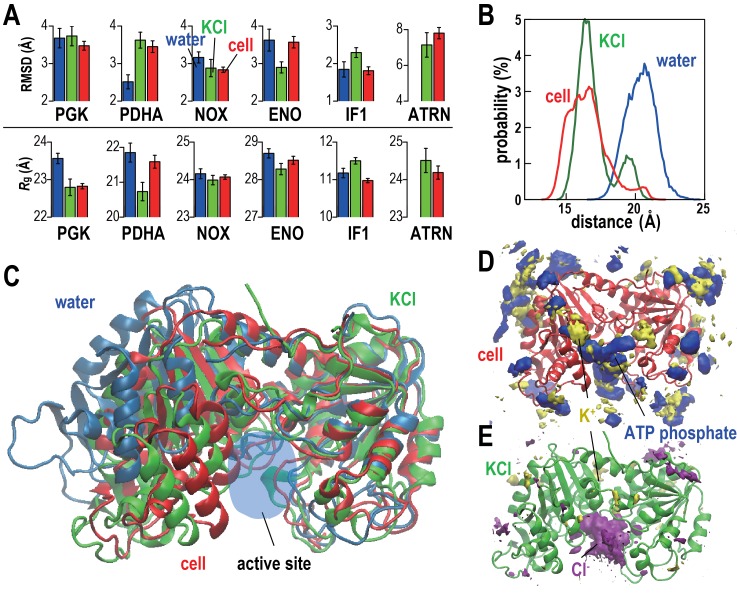
Figure 2. Conformational stability of macromolecules in crowded and dilute environments.

(A) Time-averaged RMSDs (from starting structures) and radii of gyration (Rg) for selected macromolecules in MGm1(red), in dilute solution with only counterions (blue) and with KCl excess salt (green). Statistical errors are with respect to copies of the same type. (B) Probability of the center of mass distances between the ligand binding sites dlig for PGK in MGm1 (red), in water (blue), and in KCl (green). (C): Final snapshots of PGK in MGm1 (red), in water (blue), and in KCl (green). (D) Time- and ensemble-averaged 3D distribution of atoms in the ATP phosphate group (blue, 0.002 Å−3) and K+ (yellow, 0.001 Å−3) around PGK in MGm1. (E) Time- and ensemble-averaged 3D distribution of K+ (yellow, 0.001 Å−3) and Cl- (purple, 0.001 Å−3) around PGK in KCl aqueous solution. See also supplementary Figures 1, 2 and 3 showing time series of structural stability measures and the influence of the local crowding environment on the structure of PGK and PDHA.

DOI: http://dx.doi.org/10.7554/eLife.19274.009

Figure 2.

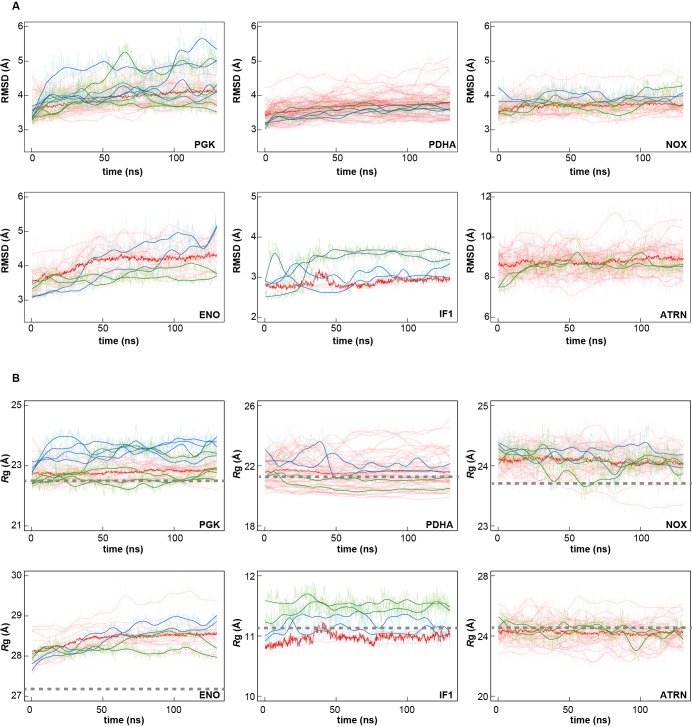
Figure 2—figure supplement 1. Time series of structural stability measures for selected macromolecules.

Figure 2—figure supplement 1.

Root mean square deviations (RMSD) relative to initial structures based on Cα or P atoms of core structures as explained in Analysis Details (A); and radii of gyration based on all Cα or P atoms (Rg; B) for PGK, PDHA, NOX, ENO, IF1, and ATRN (for abbreviations see Figure 1—figure supplement 1) in MGm1 (red), in water with only counterions (blue), and in KCl solution (green) are shown. Window-averaged time series are shown as solid lines. Rg values of initial models are indicated as dashed grey lines.
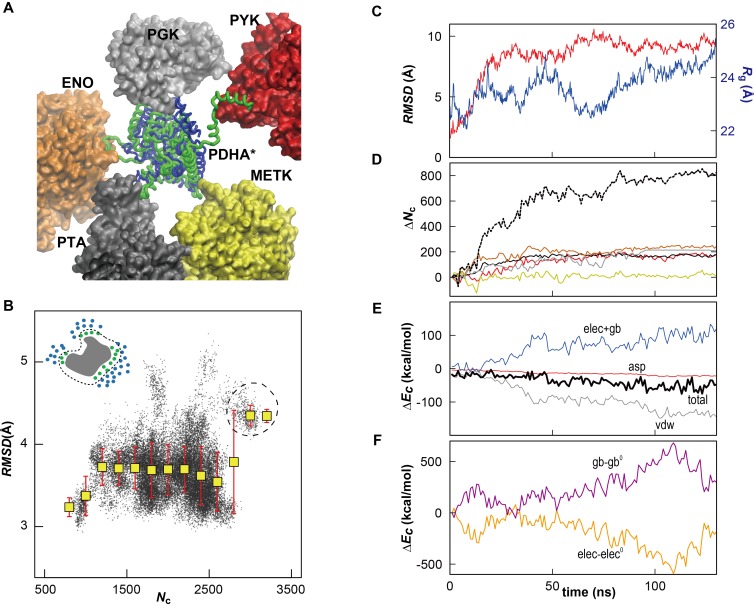
Figure 2—figure supplement 2. Influence of local crowding environment on the structure of PDHA in MGm1.

Figure 2—figure supplement 2.

(A) Denatured (green) conformation of one of the 39 copies of PDHA (denoted as PDHA*) due to contacts with other cytoplasmic proteins (PYK (red), PGK (gray), ENO (orange), PTA (black), and METK (yellow)). The initial, native, homology model is shown in blue. (B) Correlation between coordination number of crowder Cα atoms Nc (see Materials and methods) and RMSD (based on Cα atoms relative to the initial model) for PDHA. The schematic figure in upper left shows the target protein (gray) surrounded by cytoplasmic proteins (blue). The atoms counted in Nc (green) are shown in green. Histogram averages are shown as yellow boxes with standard deviations indicated as red bars. The dashed circle corresponds to the denatured state shown in panel A. Instantaneous values of Nc, dlig and RMSD were calculated using an interval of 200 ps using 39 copies of PDHA, respectively, in the MGm1 system. (C) Time history of RMSD (based on Cα atoms relative to the structure after the equilibration) (red) and radius of gyration (Rg) (blue) of PDHA*. (D) Time history of the contact pair between all atoms in the PDHA* and all atoms in five vicinal proteins (line color corresponds to those proteins in panel A) with the total value of them (dashed black). The schematic figure in the upper left shows the contact pairs (dashed line) between the atoms in two proteins (green and blue). The cutoff distance of the contact pair was set to 10 Å. (E) Time histories of the energy changes of PDHA* upon crowding (ΔEc) (i.e. the energy of all proteins (PDHA* with 5 vicinal proteins) subtracted by those energies of isolated PDHA* and the five vicinal proteins). Each energy component of ΔEc is shown with different colors (van der Waals energy (vdw; gray), cost of cavity formation calculated as 0.005 cal/mol/Å2 * SASA (asp; red), combination of the vacuum electrostatic and electrostatic solvation energies (elec+gb; blue), and the total energy (tot; thick black line). (F) Time history of the electrostatic Coulomb energy (elec; orange) and electrostatic solvation energy obtained via the GBMV generalized Born method in CHARMM (Lee et al., 2003) (gb; violet) where energies of PDHA* upon crowding relative to the initial values were elec0 = −1399 and gb= 1406 kcal/mol, respectively.
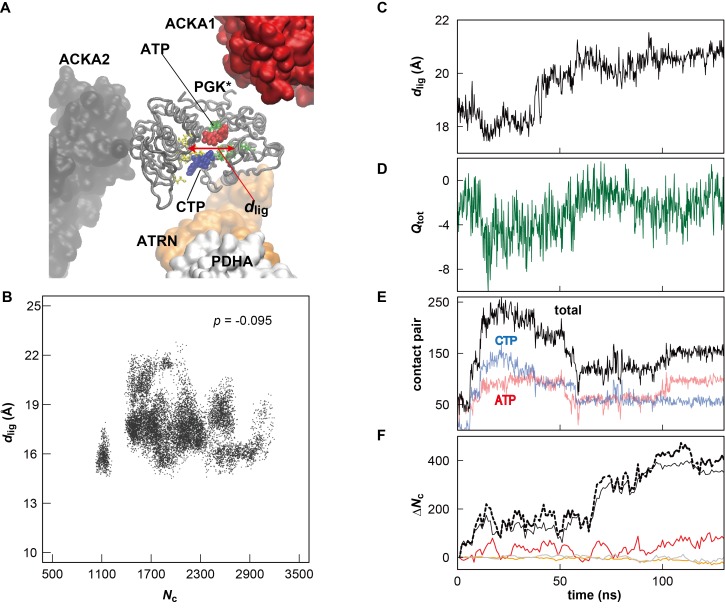
Figure 2—figure supplement 3. Influence of metabolite binding and local crowding environment on the structure of PGK in MGm1.

Figure 2—figure supplement 3.

(A) Atoms in two ligand binding sites (yellow and green licorice) of one of the 18 copies of PGK (denoted as PGK*) (gray tube) in the MGm1 system. The distance between the center of mass for Cα atoms in each site is denoted as dlig (red arrow). Two major metabolites binding the active site of PGK* are shown in red (ATP) and blue (CTP), respectively. Proteins near the PGK* (two ACKAs (red and black), ATRN (orange) and PDHA (white)) are shown in surface. (B) Correlation between Nc and dlig for all copies of PGK in MGm1 system. The correlation coefficient p between Nc and dlig is indicated. (C) Time history of dlig for PGK*. (D) Time history of the total atomic charge (Qtot) of the metabolites and ions binding the active site of PGK*. Atomic charge was counted when the minimum distance from the metabolite (or ion) atom to any Cα atoms in the active site of PGK* is smaller than 8 Å. (E) Time history of the contact pairs between all atoms in the active site of PGK* and atoms in the phosphate group of nucleotides entering the binding the site. The cutoff distance for defining a contact was set to 5 Å. (F) Time history of the contact pairs between all atoms in the PGK* and all atoms in three vicinal proteins (the line color corresponds to those proteins in panel A) with the total number of contacts shown as a dashed black line. The cutoff distance for defining a contact was set to 10 Å.