. 2016 Nov 1;5:e19274. doi: 10.7554/eLife.19274

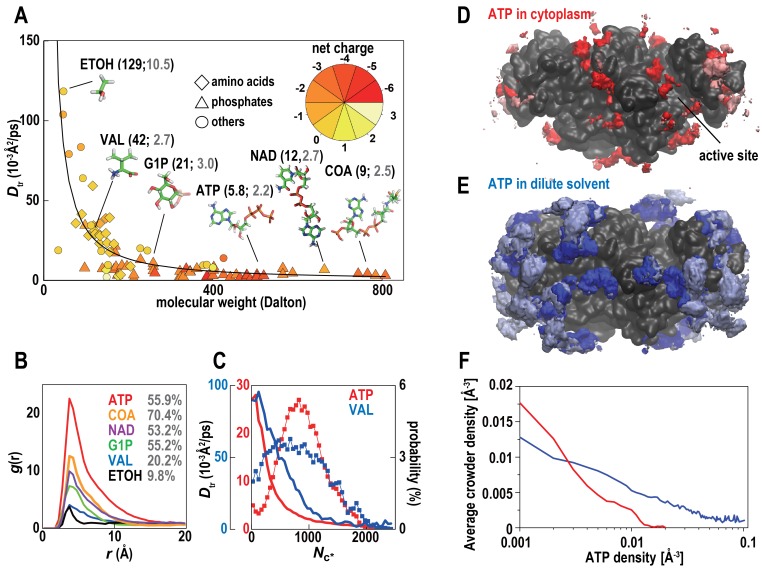
Figure 6. Metabolites in cytoplasmic environments interact extensively with macromolecules resulting in significantly reduced diffusion.

(A) Translational diffusion coefficients (Dtr) for metabolites in MGm1 as a function of molecular weight (phosphates: diamond; amino acids: triangles; others: circles; color reflects charge). For abundant metabolites, diffusion coefficients in bulk (black) and during macromolecular interaction (grey) are given in parentheses. (B) Normalized conditional distribution function, g(r), for heavy atoms of selected metabolites vs. the distance to the closest macromolecule heavy atom. The percentage of metabolites interacting with a macromolecule is listed. (C) Dtr of ATP and VAL as a function of the coordination number with macromolecules (Nc*) (line) and the distribution of Nc* (%) (line with points). (D) Time-averaged 3D distribution of all atoms in ATP (red, 0.008 Å−3) around ACKA molecules in MGm1. Pink color indicates regions where all-atom crowder densities also exceed 0.008 Å−3. (E) Same as in (D) but the density of ATP is shown in dilute solvent (blue) with light blue indicating overlap with the crowder density distribution form the MGm1 simulations. (F) Correlation between average crowder atom densities in MGm1 and volume density grid voxel ATP densities in dilute (blue) and crowded (red) environments. In the dilute case, we compute the crowder atom densities in MGm1 as a function of the grid ATP densities in the dilute simulations of PDHA. Therefore, high average crowder atom densities in the cytoplasmic model at sites with high ATP densities under dilute conditions means that those ATP sites would be displaced by interacting crowders in the cytoplasmic environment. See also supplementary Figure 1 showing analysis details for the calculation of the ATP distributions.

DOI: http://dx.doi.org/10.7554/eLife.19274.024

Figure 6.

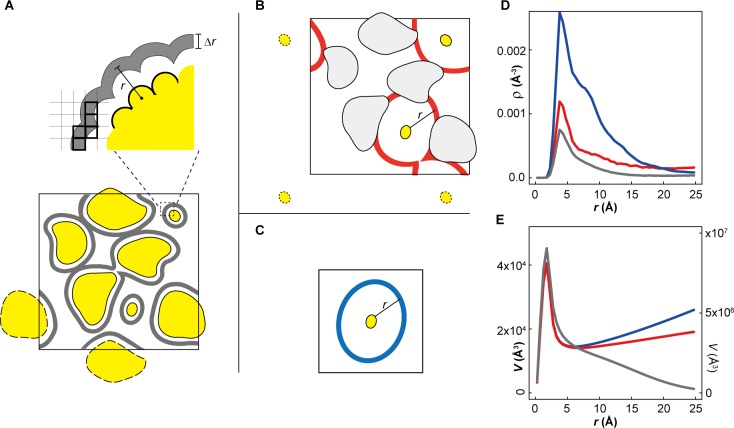
Figure 6—figure supplement 1. ATP distribution in cytoplasmic environments.

Figure 6—figure supplement 1.

(A) Schematic representation of theoretically accessible volume, V(r), in crowded environments. The large square box represents the size of the periodic system. The yellow objects represent macromolecules with replicas in an adjacent image outlined with dashed lines. The gray layers surrounding macromolecules represent V(r) with the thickness Δr at a distance r from the closest atom of any macromolecule. Thick black squares indicate the grid elements with centers included when accumulating V(r). (B) V(r) (red layers) at a distance r from the closest atom of any proteins belonging to a given macromolecule type (e.g., ACKA). With larger r, V(r) is interrupted by other macromolecules. In this case, the part of the V(r) overlapping with the van der Waals surface of macromolecules is eliminated. (C) V(r) at distance r from the closest atom of single protein under dilute conditions. (D) Profiles of the heavy atom number density of ATPs (ρ(r)) as a function of the closest distance from any heavy atom of ACKAs in the MGm1 system (red) and from any heavy atom in single ACKA in dilute solvent with metabolites (blue). The black line indicates the profile of ρ(r) as function of the closest distance from any heavy atom of the macromolecules in the MGm1 system. (E) Profiles of the theoretically accessible volume V(r) as a function of the closest distance from any heavy atoms in ACKAs in MGm1 (red) and from any heavy atom in ACKA_m (blue). The gray line shows the profile of V(r) as a function of the closest distance from any macromolecule heavy atom in the MGm1 system. The profile around ACKAs in MGm1 (red lines in D and C) was obtained by dividing the total volume of V(r) by the number of ACKA copies in the MGm1 system.