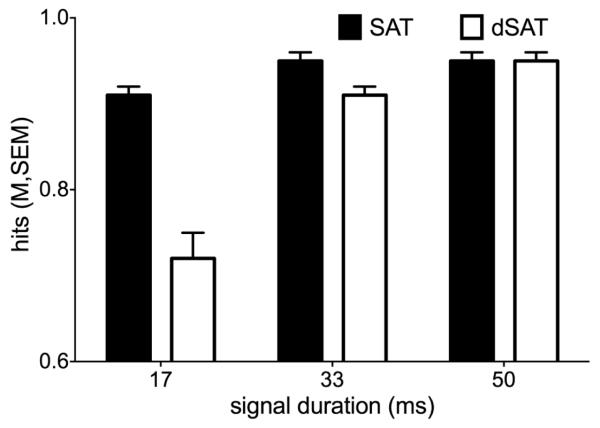
Figure 2. Distraction decreases hit accuracy.
Bars represent the mean proportion of hits for each signal duration for the no-distraction SAT condition (black bars) and for the dSAT condition with distraction (white bars). Error bars represent the between-subjects standard error around the mean. Hit accuracy on signal trials decreased as a function of decreasing signal duration and in the presence of distraction.

