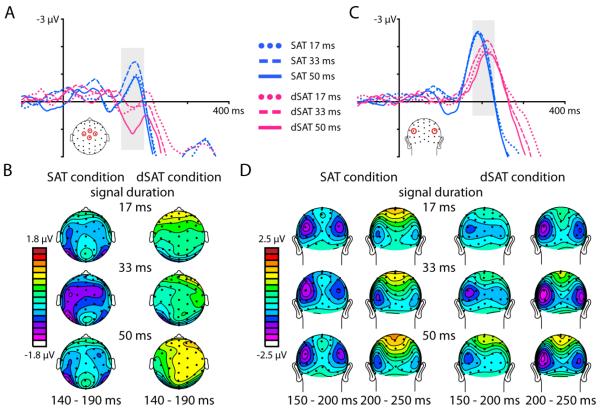
Figure 3. Distraction disrupts early-latency signal detection processes.
Distraction severely disrupted an early anterior negativity (anterior N2 component, latency 140-190 ms). A) ERP traces from channels FCz, Cz, C1a, and C2a (see head schematic) time-locked to the onset of detected signals (durations 17, 33, or 50 ms) in the SAT (blue traces) and dSAT (pink traces) conditions. B) Topographies of the mean amplitude (from 140 to 190 ms) of the response to detected signals, for each duration and task condition. C) Detected signals also evoked a posterior negativity over bilateral occipital cortex (posterior N2 component starting ~150 ms). ERP traces averaged from channels P3i and P4i (see head schematic) and time-locked to the onset of detected signals (durations 17, 33, or 50 ms) in the SAT (blue traces) and dSAT (pink traces) conditions show this posterior N2 was smaller in amplitude and delayed in latency during distraction (dSAT). D) Topographies of the mean amplitude of the response to detected signals show the posterior N2 activity over bilateral occipital cortex. Two time windows (150 to 200 ms and 200 to 250 ms) are included to illustrate the delayed latency of the posterior N2 during distraction.

