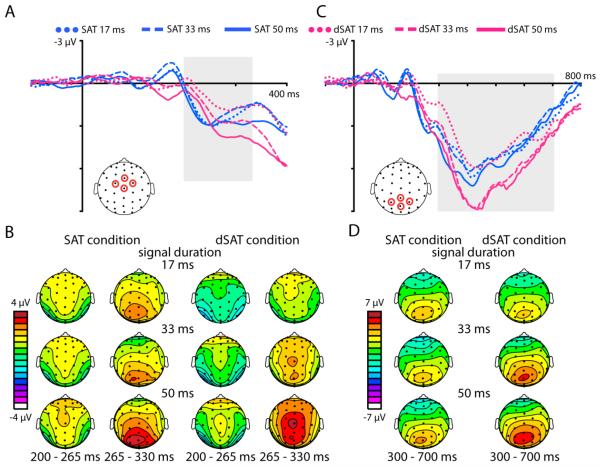
Figure 5. Distraction modulates longer-latency activity reflecting signal detection processes.
Detected signals evoked a fronto-central P3a starting at ~200 ms post-signal onset, followed by a large P3b component over parietal cortex starting at ~300 ms. A) ERP traces are time-locked to the onset of detected signals, for each signal duration (17, 33, and 50 ms). The blue traces represent the no-distraction SAT condition and the pink traces represent the dSAT condition with distraction. Traces are averaged from 4 frontocentral channels (see diagram for locations). Distraction delayed the onset of the P3a component, and reduced the P3a amplitude for the 17 ms signal duration. B) Topographies showing the mean amplitude of activity from 200 to 265 ms and 265 to 330 ms post-signal onset for each signal duration and the SAT and dSAT conditions. Two time windows are shown in order to illustrate the distraction-related delay in the P3a latency. In the SAT, the fronto-central P3a is visible starting at 200 ms post-signal onset, while the more parietal activity of the subsequent P3b is evident in the plots from 265-330 ms. In the dSAT, the P3a activity was significantly delayed in time. C) Following the fronto-central P3a, a large-amplitude P3b was observed over parietal cortex. The ERP traces are plotted from channels CPz, Pz, P1, and P2 for each signal duration for the both the SAT (blue traces) and dSAT condition (pink traces). Distraction enhanced the P3b amplitude for the 33 and 50 ms durations. d) Topographies of the mean amplitude from 300 to 700 ms post-signal onset, for each signal duration for the SAT and dSAT conditions, showing the distribution of the parietal P3 activity.

