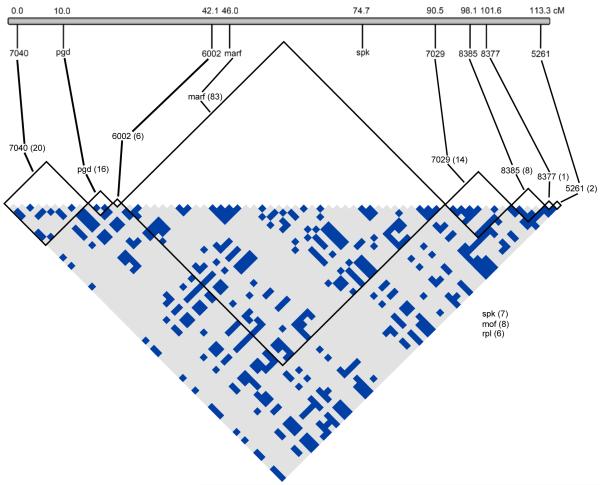
Figure 1.
Linkage disequilibrium between SR and ST chromosomes. Recombination mapping was performed to determine location of the markers across the standard X-chromosome (ST) in centimorgans (cM). The matrix shows sites with significant R2 values between pairs of SNPs within and between each marker calculated using only parsimony informative sites. Only sites with significant associations are pictured, with the total numbers of sites considered for each marker noted in parentheses. All ST and SR samples were included in the analysis. Significance was determined using a Fisher’s Exact Test with a Bonferroni correction for multiple testing. Light grey squares indicate nonsignificant associations (p > 0.05) and blue squares indicate associations significant after correcting for multiple testing. mof and rpl were unable to be mapped but had no significant associations. See Figure S3 for R2 values when ST and SR are considered separately.

