
Figure 2.
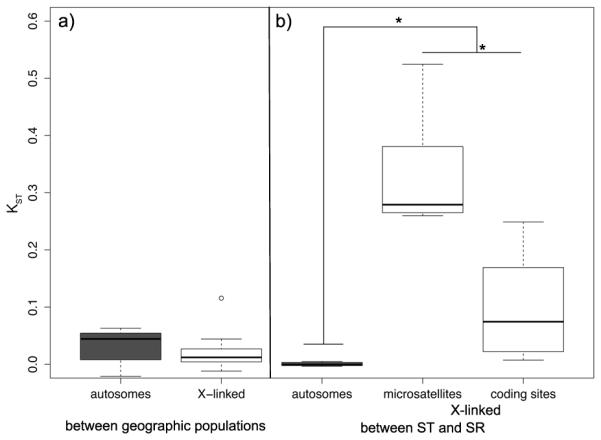
Pairwise KST per marker (a) between geographic populations and (b) between ST and SR males. White boxes are X-linked markers, and grey boxes are autosomal markers. The edges of the boxes are the first and third quartiles, and the dark grey line is the median. The whiskers extend to the last data point before 1.5x the interquartile range.