
Figure 6.
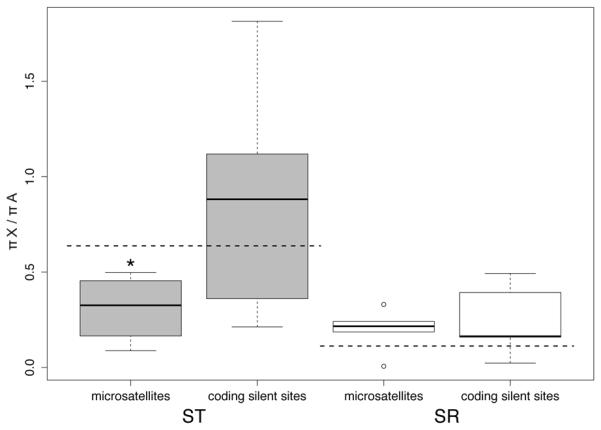
Ratio of average π (pairwise nucleotide differences) on the X-chromosome to average π on the autosomes for both ST (grey boxes) and SR (white boxes). Only silent sites were used for the protein coding genes. The horizontal dashed lines represent the expected X/A ratio of (0.75 * 0.85 = 0.64) for ST and (0.75 * 0.15 = 0.11) for SR. The edges of the boxes are the first and third quartiles, and the dark grey line is the median. The whiskers extend to the last data point before 1.5x the interquartile range.