
Figure 7.
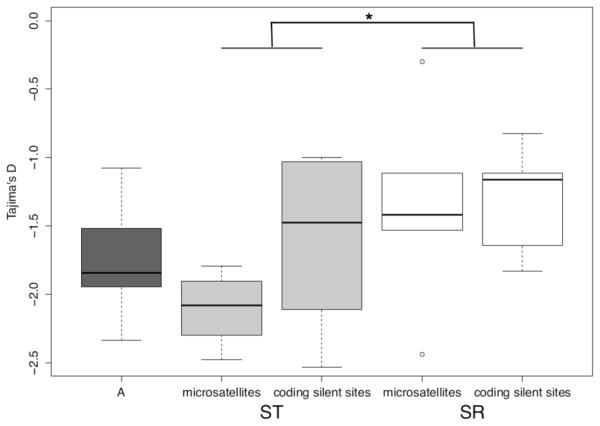
Tajima’s D values for microsatellite flanking regions on ST and SR and silent sites in protein coding genes on ST (light grey), SR (white), and the autosomes (A, in dark grey). The edges of the boxes are the first and third quartiles, and the dark grey line is the median. The whiskers extend to the last data point before 1.5x the interquartile range.