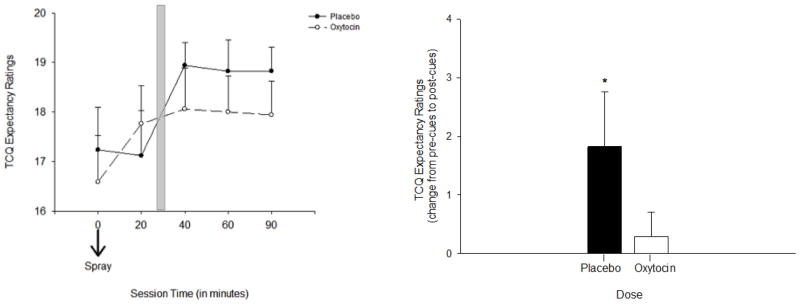
Figure 1.
Smoking Craving on the S-TCQ Expectancy Scale in response to smoking cues following OT and placebo. Left panel: subjective craving on the S-TCQ Expectancy scale following the second OT and placebo administration (time 0 minutes). Shaded bar indicates cue exposure period. Right panel: change in ratings on the S-TCQ Expectancy before and after cues. Asterisk indicates a significant increase following placebo, p < 0.05. Capped bars indicate SEM.

