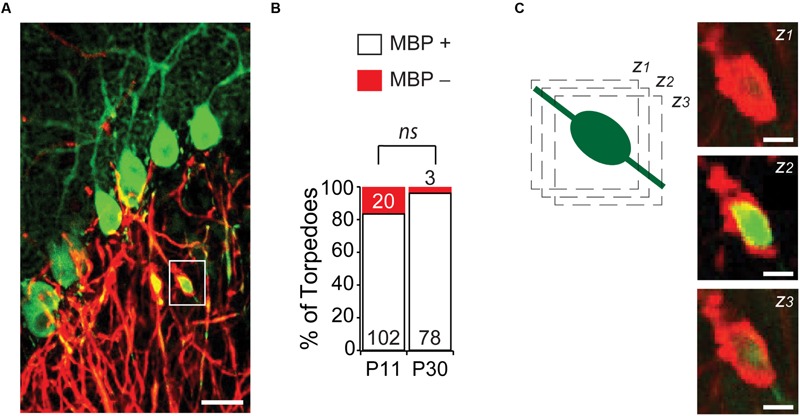
FIGURE 5.

Most developmental torpedoes are myelinated. (A) Sample image showing Purkinje cells and axons (green) as well as myelin basic protein (MBP; red). Scale bar, 20 μm. (B) The vast majority of torpedoes at both P11 and P30 are positive for MBP (white bars), with only a fraction negative for MBP (red). Number of torpedoes (N) is indicated in or above each bar. (C) Successive z-stack images (z1-3) of region highlighted in panel (A), highlighting that myelin appears to fully wrap around Purkinje axon developmental torpedo. Scale bar, 5 μm. Significance determined by Mann–Whitney U test, ns P > 0.05.
