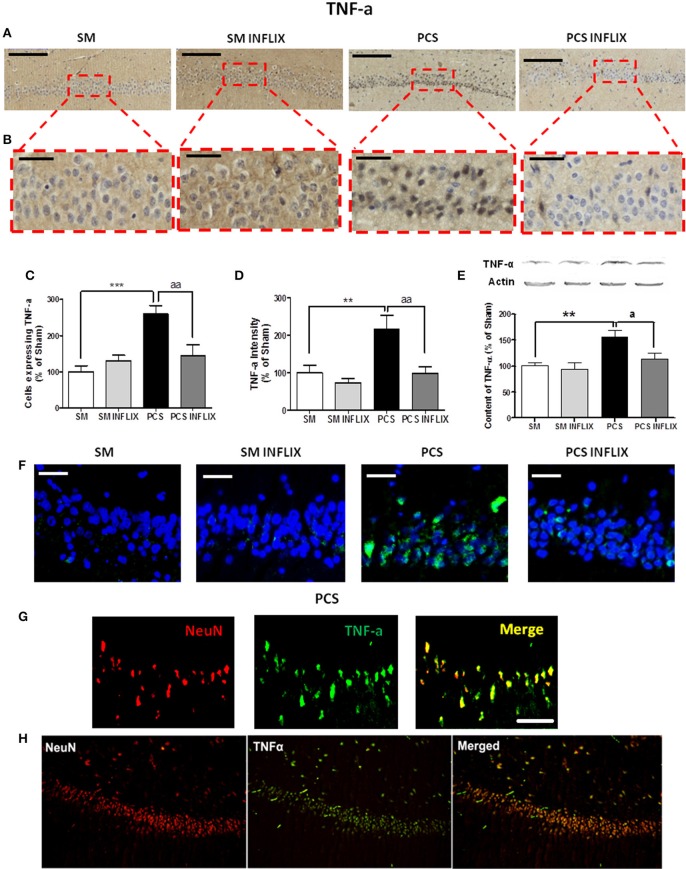
Figure 4.
TNF-a levels are increased in hippocampus of PCS rats and are normalized by infliximab. Rats were sacrificed and hippocampus dissected 8 weeks after PCS surgery. Immunohistochemistry was performed using anti-TNF-a. (A) Representative low (scale bar = 200 μm) and (B) high (scale bar = 50 μm) magnification images are shown. The number of cells expressing TNF-a (C) and intensity of the staining for TNF-a (D), were quantified. One-way ANOVA with Tukey post-hoc test was performed to compare all groups. Differences between groups were statistically different: (B) F = 9.4, Dfn = 3, Dfr = 52, p < 0.0001; (C) F = 7.3, Dfn = 3, Dfr = 51, p < 0.001; and variances were not statistically different. Values are the mean ± SEM of 4 rats per group. For each rat at least 120–150 cells from four different sections were counted. (E) Western blot was performed as described in method. Values are the mean ± SEM of 10–14 rats per group. One-way ANOVA with Tukey's post-hoc test was performed to compare all groups. The differences between groups were statistically different (p < 0.001, F = 6.9, Df between groups = 3) and variance was not statistically different. (F) Representative images of in situ hybridization for TNF-a mRNA (green color; scale bar = 50 μm). (G) Double fluorescence staining of the neuronal marker NeuN (red), TNF-a mRNA (green), and merged (yellow) showing co-localization in PCS rats (Scale bar = 50 um). (H) Low magnification images (10 ×) of the neuronal marker NeuN (red), TNF-a mRNA (green), and merged (yellow) showing co-localization in PCS rats. Values significantly different from controls are indicated by asterisks and values different from PCS rats by a. ap < 0.05; **p < 0.01; ***p ≤ 0.005; aap < 0.01.

