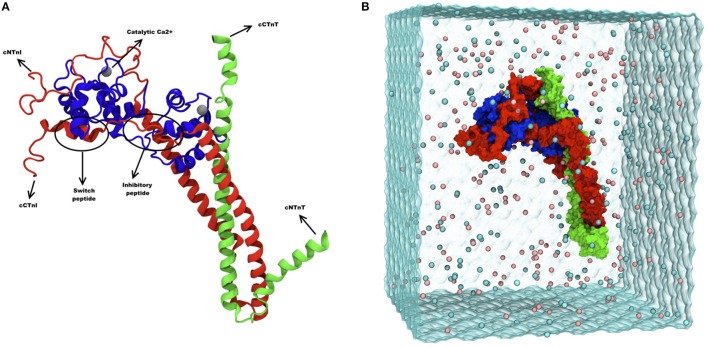
Figure 1.
(A) Ribbon diagram of troponin and its different subunits. Blue represents TnC (1–161), red represents TnI (1–171) and green represents TnT (212–298). Catalytic and structural Ca2+ are shown as gray spheres, and the inhibitory and the switch peptide of TnI are indicated. (B) Snapshot of troponin MD simulation, showing troponin surface rendering in a solvent box. Blue represents TnC (1–161), red represents TnI (1–171) and green represents TnT (212–298). The image was adapted from Zamora et al. (2016a) with permission from the PCCP Owner Societies.

