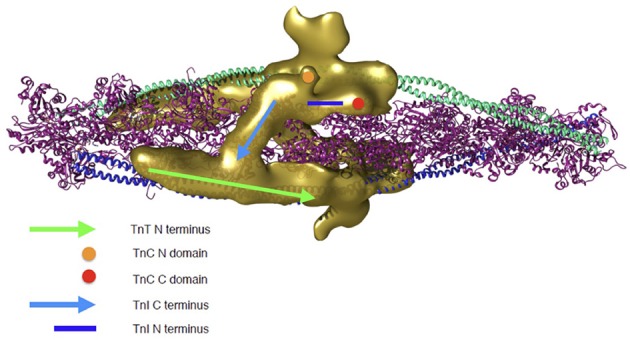
Figure 2.

Troponin rendering onto the thin filament. Thin filament is represented by two coiled coil tropomyosin monomers shown in cyan and blue, decorated by actin monomers shown in ribbon view in magenta. Troponin's electron density as determined by 3D reconstruction from cryo-EM is represented in golden. Two troponin monomers are shown as they are predicted to be located on the thin filament and the different regulatory regions are indicated. Green arrow, N-terminus of TnT; light blue arrow, C-terminus of TnI (dynamic region); dark blue line, N-terminal extension of TnI (dynamic region); Orange circle, N-terminal domain of TnC; Red circle, C-terminal domain of TnC. The 3D reconstruction coordinates were kindly supplied by Dr William Lehman (Boston University, MA, USA) and the image was constructed by Mr Juan Eiros Zamora (Imperial College London, UK).
