Figure 5.
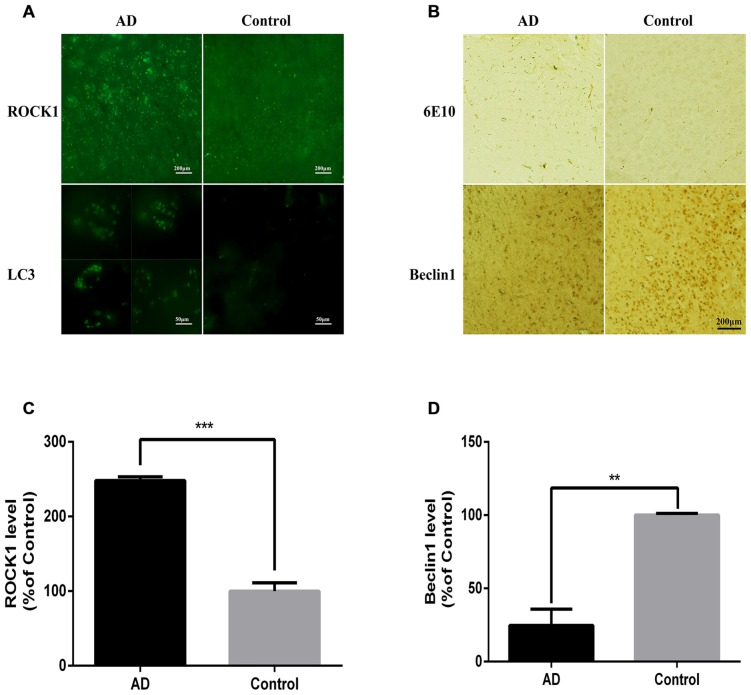
ROCK1 is up-regulated with neuronal autophagosome accumulation in AD mice. (A) Representative ROCK1 (upper panels) and LC3 (lower panels) immunofluorescence in AD and normal mouse brain sections. (B) Representative immunohistochemical (IHC) micrographs of Aβ (6E10, upper panels) and Beclin1 (lower panels) immunofluorescence in AD and normal mouse brain sections. (C) Quantification of ROCK1 immunopositive neurons in AD mouse brain sections compared to control sections (n = 4). (D) Quantification of Beclin1 immunopositive neurons in AD mouse brain sections compared to control sections (n = 4). Data are expressed as mean ± SEM; **p < 0.01, ***p < 0.001.

