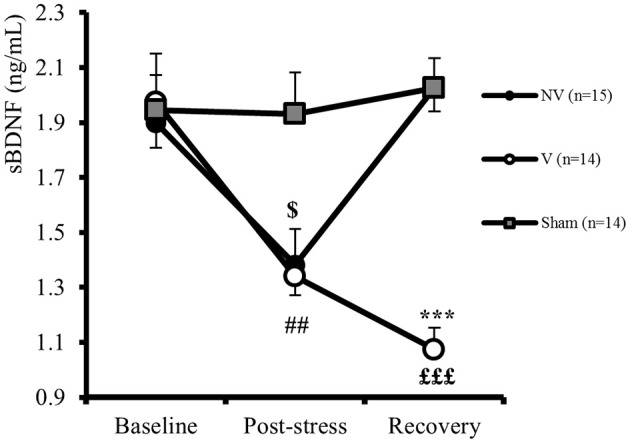
Figure 3.

Time course of sBDNF (ng/mL) in Sham (Sham, n = 14), Vulnerable (V, n = 14), and Non-Vulnerable (NV, n = 15) rats. Statistical differences were evaluated by ANOVA for repeated measures between V and NV (Group*Time effect: p < 0.001) followed by post-hoc Bonferroni test. The results are expressed as following: between V and NV at Recovery: ***p < 0.001; for NV between Post-stress and Baseline: $p < 0.05; for V between Post-stress and Baseline: ##p < 0.01; for V between Recovery and Baseline: £££p < 0.001. Differences with Sham at each time were evaluated by factorial ANOVA at Baseline [F(2, 40) = 0.08, ns], at Post-Stress [F(2, 40) = 5.13, p < 0.05, post-hoc Bonferroni test: NV vs. Sham: p < 0.05, V vs. Sham: p < 0.05], and at Recovery [F(2, 40) = 36.41, p < 0.001, post-hoc Bonferroni test: NV vs. Sham: ns and V vs. Sham: p < 0.001] (not shown on figure). Values are given as mean ± SEM.
