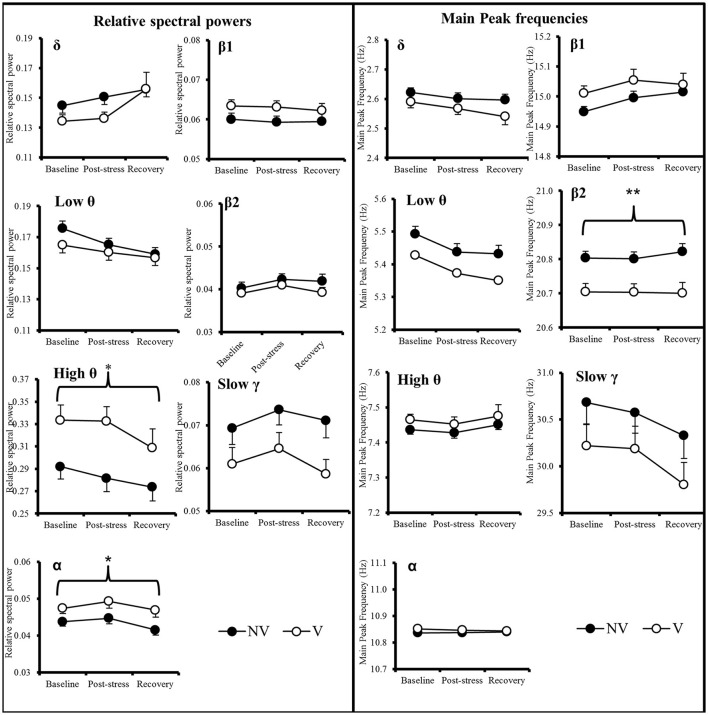
Figure 4.
Time course of the relative spectral power and main peak frequencies in δ, low θ, high θ, α, β1, β2, and slow γ in Vulnerable (n = 14) and Non-Vulnerable (n = 15) rats. Comparisons were carried out using ANOVA for repeated measures followed if necessary by post-hoc Bonferroni tests. The significant Group effects between NV and V are expressed as: *p < 0.05; **p < 0.001 above the horizontal brace spanning the three time points. Values are given as mean ± SEM.

