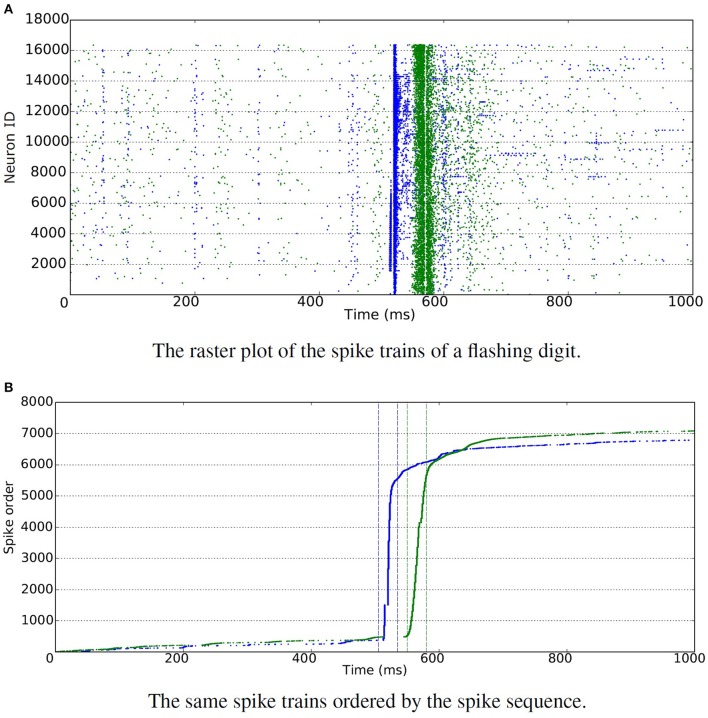
Figure 4.
DVS sensor with flashing input. Blue is used for “ON” events and green for “OFF” events. (A) The raster plot shows spikes generated by individual neurons over time. It is hard to recognize the total number of spikes due to the large number of neurons involved in the figure. Thus all the spikes are ordered in time, and displayed in the figure below. (B) The raster plot shows ordered spike sequence over time. The total number of spikes are around 7000 for both “ON” and “OFF” events. The bursty nature of the resulting spikes is illustrated, where most of the spikes occur in a 30 ms time slot.

