Figure 9.

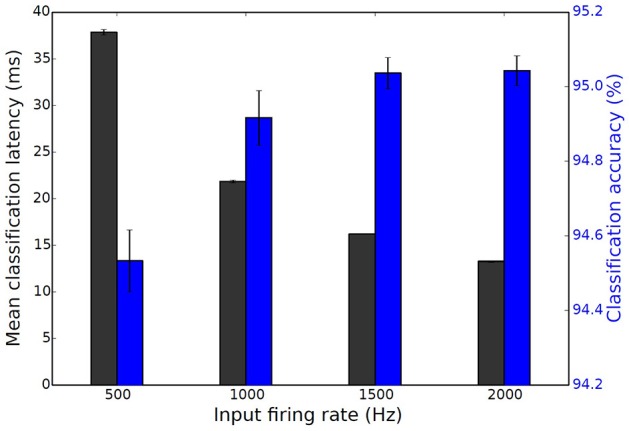
Mean classification latency (black) and classification accuracy (blue) as a function of the input firing rate for the spiking DBN. Results are averaged over 4 trials, error bars show standard deviations (Stromatias et al., 2015b).

Mean classification latency (black) and classification accuracy (blue) as a function of the input firing rate for the spiking DBN. Results are averaged over 4 trials, error bars show standard deviations (Stromatias et al., 2015b).